
HOME / SERVICES / DATA ANALYTICS
DATA ANALYTICS SERVICES
OUR CORE STRENGTHData Analytics & Power BI Consulting
This is what most people actually mean when they say “we need better data”: the dashboards, KPIs and reports that turn a warehouse full of tables into a number a room full of people can act on, without a side debate about whose spreadsheet is right.
95%
FASTER REPORTING
1
SOURCE OF TRUTH
3x
DECISION SPEED
OVERVIEW
What is data analytics consulting?
Data analytics consulting helps a business turn the data it already collects into reporting people use to make decisions. In practice that means agreeing on the KPIs that matter, building dashboards that track them, and making sure the numbers behind those dashboards are right.
Most companies we speak to aren’t short of data. They’re short of agreement. Sales has one revenue figure, finance has another, and the leadership meeting spends twenty minutes on whose spreadsheet to believe before anyone discusses what to do. A good analytics setup ends that debate by giving everyone the same definitions, the same source and the same view.
Stack Homme is a Power BI consultancy at heart. We design and build Power BI dashboards, executive reports and self-service analytics for teams across the US, UK and Europe, and connect them to your data through Microsoft Fabric, Azure or Databricks when the reporting needs a stronger foundation.
Signs your team needs better data analytics
- Leadership meetings start with a debate about which numbers are correct.
- Someone on your team spends days each month rebuilding the same report by hand in Excel.
- You already pay for Power BI, but the dashboards are slow, cluttered or rarely opened.
- Different departments define the same KPI in different ways.
- Managers wait on an analyst every time they need a new view of the data.
- You can see what happened last month, but not why it happened.
Recognize two or more of these? Book a free consultation.
HOW WE WORK
How we deliver data analytics projects
01
Start with the decision, not the chart
We sit down with whoever actually reads the reports, not just whoever requested them, and work backward from the three or four decisions the dashboard needs to support.
02
Dashboards built around your numbers
That turns into Power BI dashboards and executive reporting built around your KPIs instead of a stock template, with drill-downs for the people who need detail and one clean number for the people who don’t.
03
Adoption, not just delivery
We walk each audience through their dashboard, fix whatever confuses them, and check that it is actually being opened after launch. A report only earns its keep if it gets used every week.
04
Handed off, not handcuffed
Self-service reporting your team can extend on its own, without submitting a ticket every time a filter needs to change.
WHAT YOU GET
- An agreed KPI framework with definitions, owners and targets
- Power BI dashboards and executive reports, published and shared
- A reusable semantic model your team can build new reports on
- Scheduled refreshes that replace manual spreadsheet reporting
- Training and documentation for report owners and viewers
TECH STACK
Power BI is our primary platform. Behind it, we connect to your data through the Microsoft stack and Databricks, and to the spreadsheets your team still relies on.
- Power BI
- Microsoft Fabric
- Microsoft Azure
- Databricks
- SQL
- Excel
ONGOING SUPPORT
Ongoing analytics and Power BI support
Business questions keep changing after a dashboard goes live. We offer ongoing support to add new KPIs and reports, keep refreshes running, tune performance as your data grows, and help new team members get up to speed. The result is a reporting setup that evolves with the business instead of slowly going stale.
Data Analytics Expertise Built Around Your Industry
A KPI that matters in retail can be noise in healthcare. We build reporting around how your industry actually measures success.
COMMON QUESTIONS
Data Analytics FAQs
- Which BI tool do you build in?
- Power BI is our primary platform. Executive dashboards, KPI tracking and self-service reporting are all built there.
- How is data analytics different from business intelligence?
- The terms overlap. Business intelligence usually means the tools and dashboards that report on performance; data analytics is the broader work of defining KPIs, analyzing trends and explaining why the numbers moved. We do both, with Power BI as the main delivery tool.
- We already have dashboards nobody trusts. Where would you start?
- With the decision, not the chart. We sit down with whoever actually reads the reports, not just whoever requested them, and work backward from the three or four decisions the dashboard needs to support.
- Can you fix or rebuild our existing Power BI reports?
- Yes. Slow, cluttered or untrusted Power BI reports are a common starting point. We review the data model, measures and layout, then either fix what is there or rebuild it around the decisions the report is meant to support.
- Do we need a data warehouse before you can build anything?
- Not necessarily. Plenty of reporting can be built on what you already have. If the underlying data needs cleaning up first, that is what our data engineering work is for.
- Can our team change reports without coming back to you?
- That is the intent. We build self-service reporting your team can extend on its own, without submitting a ticket every time a filter needs to change.
- Do you provide support after the dashboards launch?
- Yes. Ongoing support covers new reports and KPIs, refresh monitoring, performance tuning and training for new users. It is optional, and everything is documented so your team can run it alone if you prefer.
- What does the free consultation cover?
- We talk through the decisions you’re trying to make, the data you have and where reporting falls short today. You leave with a clear view of whether analytics can help and what a sensible first step looks like, with no obligation.
CASE STUDIES
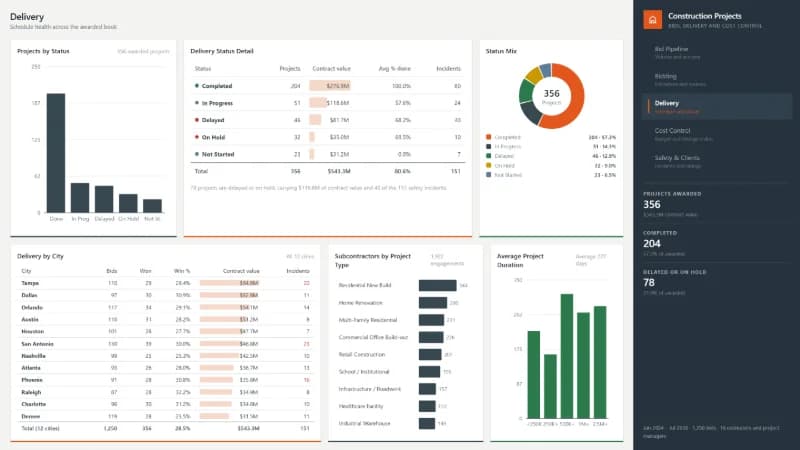
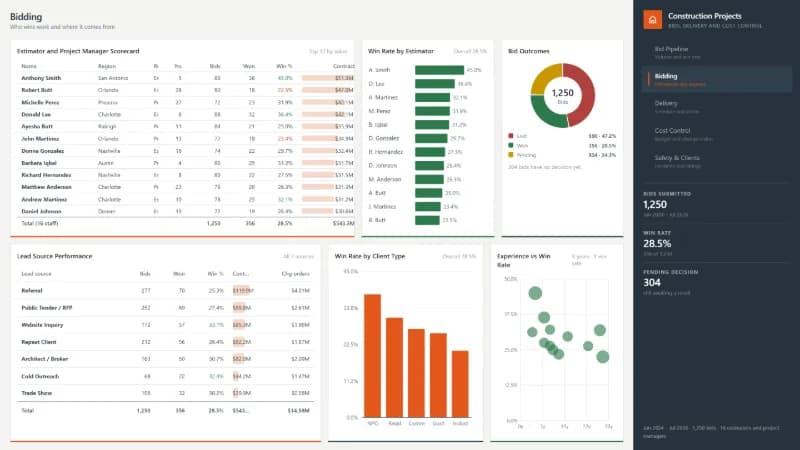
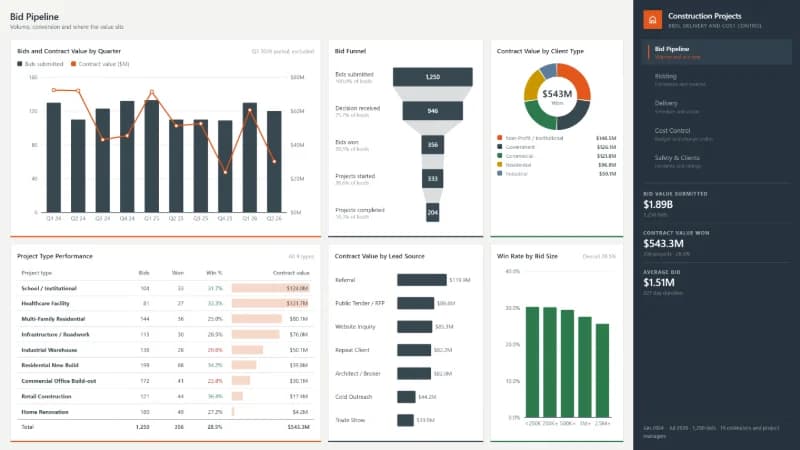
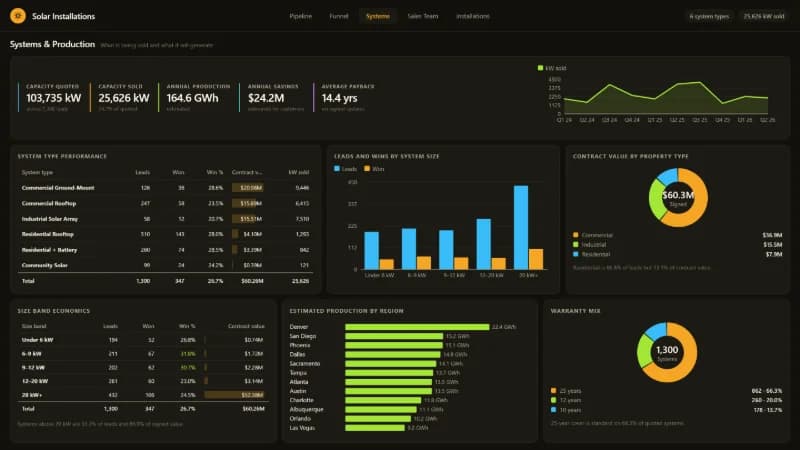
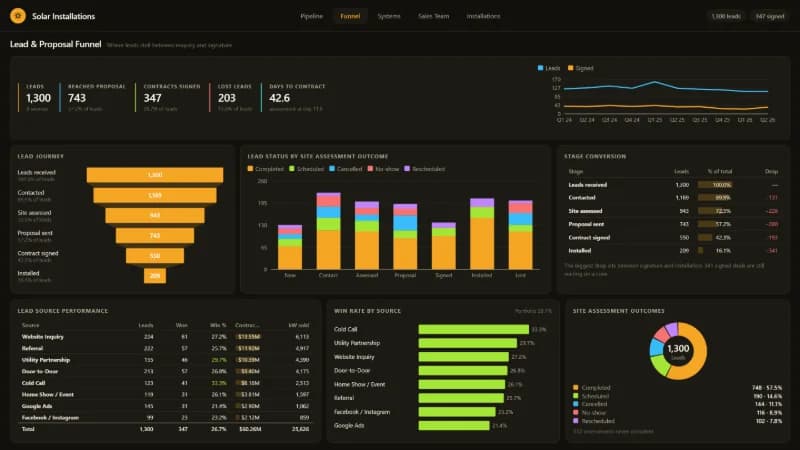
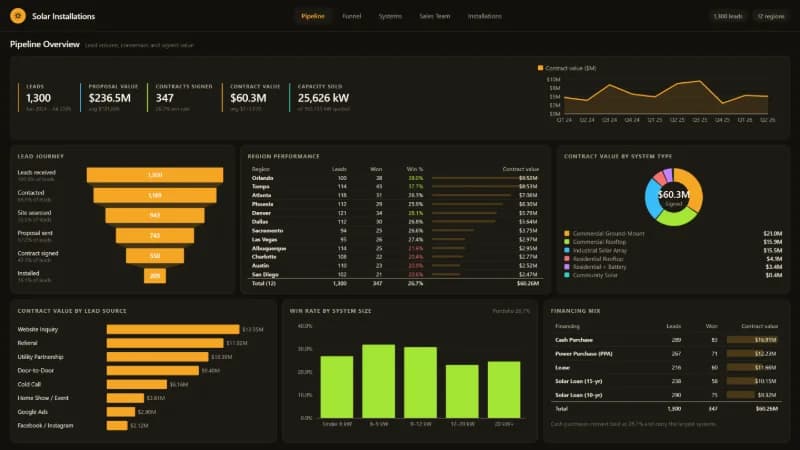
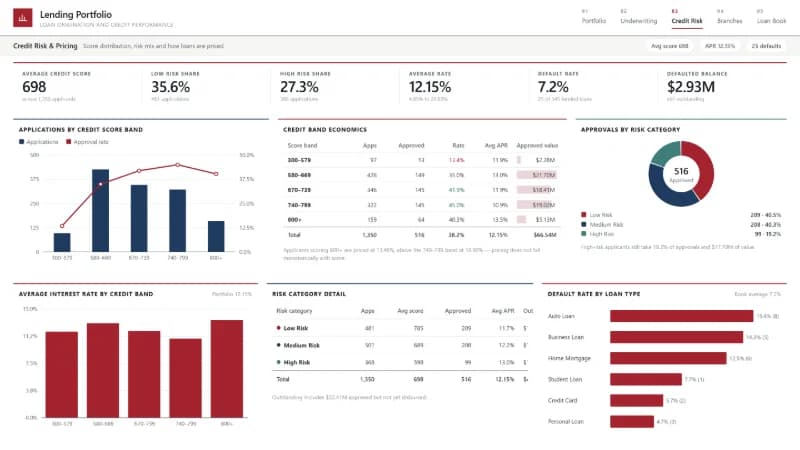
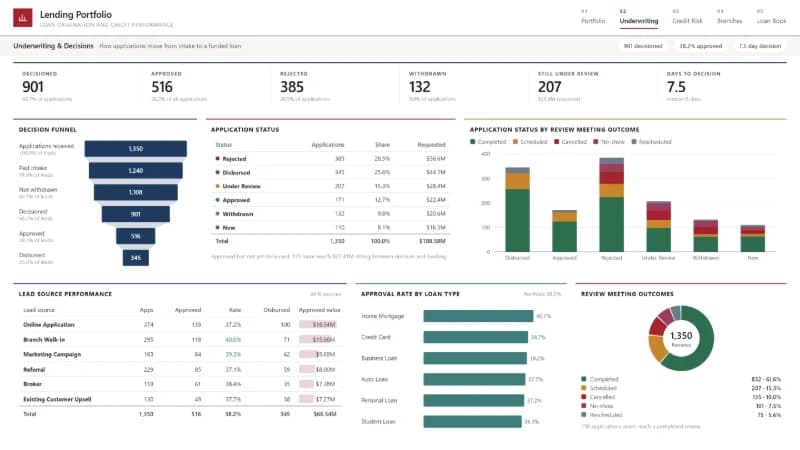
Data Analytics in real reports
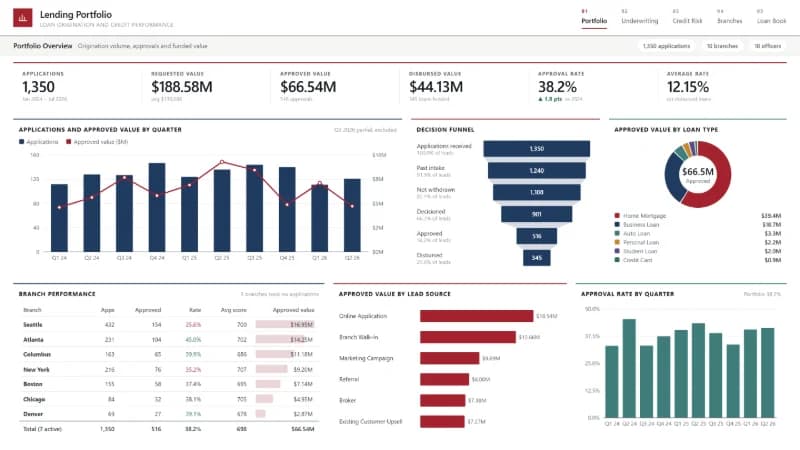
Published work where this service did the heavy lifting. Each case study walks through the five pages of the report and the figures behind them.
WHO THIS IS FOR
This is for teams currently making calls off gut feel, a patchwork of spreadsheets, or a dashboard nobody really trusts anymore.
Talk about your dashboards