
HOME / WORK / SOLAR INSTALLATIONS
CASE STUDY · ENERGY
Solar Installations
LEAD TO INSTALL FOR A SOLAR SALES TEAM
Follows 1,300 solar leads across 12 regions from first enquiry to a signed contract and an installed system, with the funnel, system mix, sales team and installations each on their own page.
LEADS
1,300
Jan 2024 – Jul 2026
CONTRACT VALUE
$60.3M
347 contracts signed
WIN RATE
26.7%
347 of 1,300 leads
CAPACITY SOLD
25,626 kW
of 103,735 kW quoted
WALK THE REPORT
Five pages, one question each
Each page answers one question the leadership team asks every week. Pick a page to see it full size.
THE QUESTION
How many leads come in, how many sign, and what are they worth?
$236.5M
proposal value quoted
347
contracts signed at a 26.7% win rate
209
systems installed, 16.1% of leads
CONTEXT
Why a solar installer needs this report
Solar sales is a long funnel with a physical job at the end of it. A lead is contacted, surveyed, quoted, signed, financed, scheduled and finally installed, and every one of those stages is usually tracked by a different team in a different tool.
The result is that nobody can say where the funnel actually leaks. Sales sees enquiries and signatures; operations sees the install calendar. The number that matters — how many of this month's leads become installed kilowatts, and how long that takes — falls between the two.
How the report is built
One model follows a lead from first enquiry through proposal, signature and installation, with five pages splitting the story into pipeline, funnel, system mix, sales team and delivery.
Capacity is carried alongside currency all the way through, so the same report answers commercial questions in dollars and operational questions in kilowatts, by region, system type, financing type and crew.
WHAT IT BRINGS TOGETHER
- Lead capture and enquiry sources
- Proposal and quoting records
- Signed contracts and financing type
- System specifications and capacity
- Sales rep and region assignments
- Installation scheduling and crews
WHO IT SUITS
Residential and commercial solar installers with a regional sales team, where lead, quoting and installation data sit in separate systems.
PAGE BY PAGE
What each page of the solar installations report answers
PAGE 01
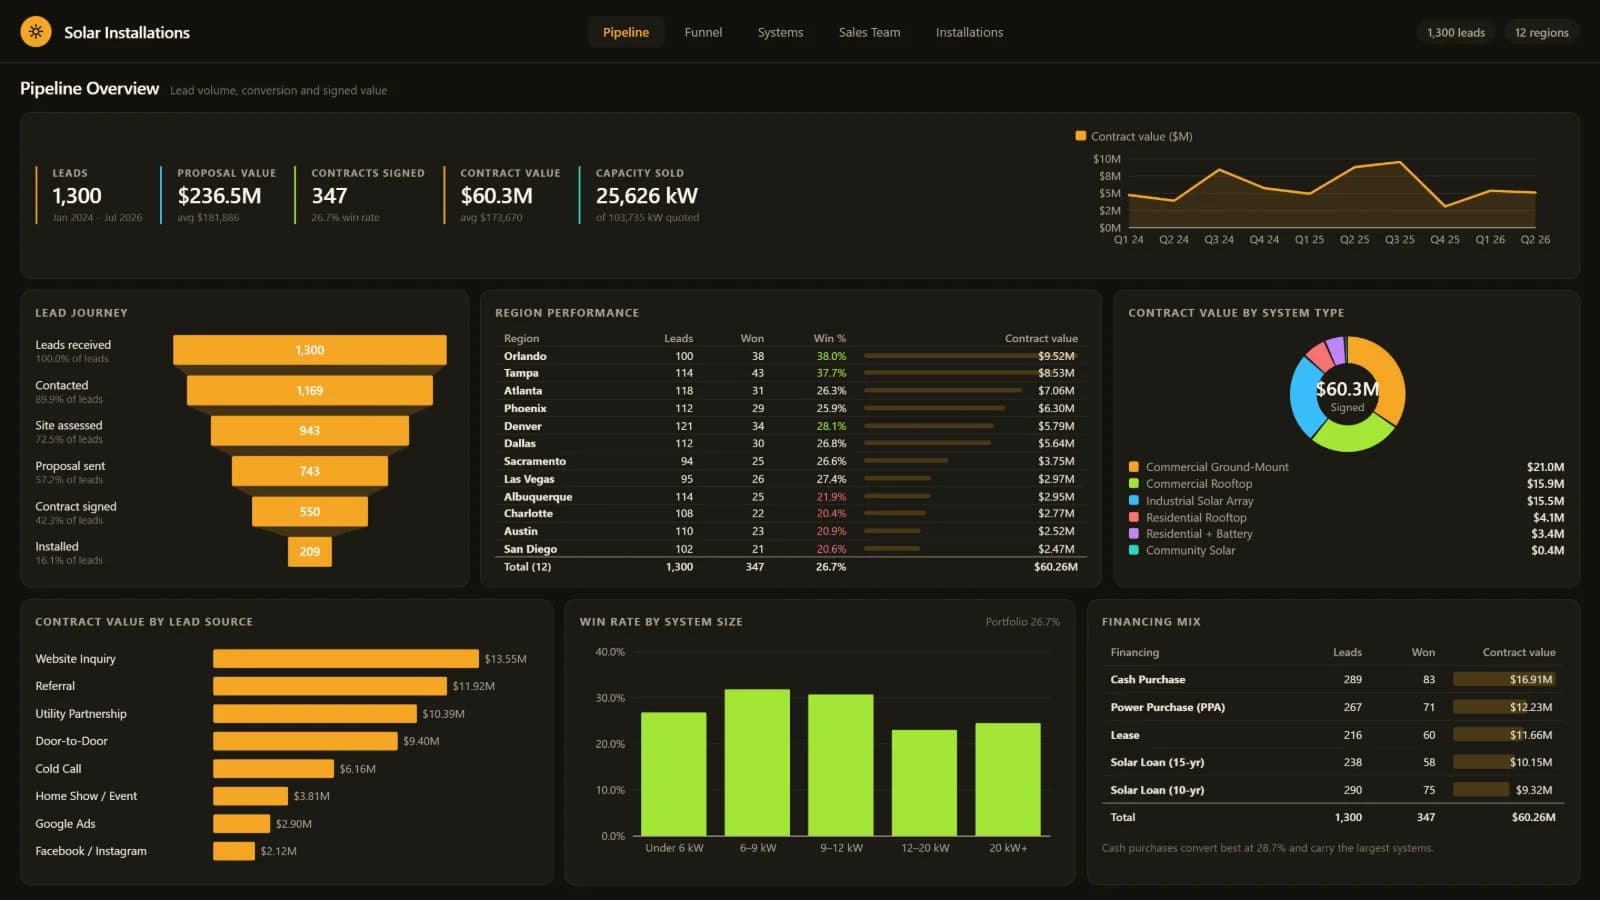
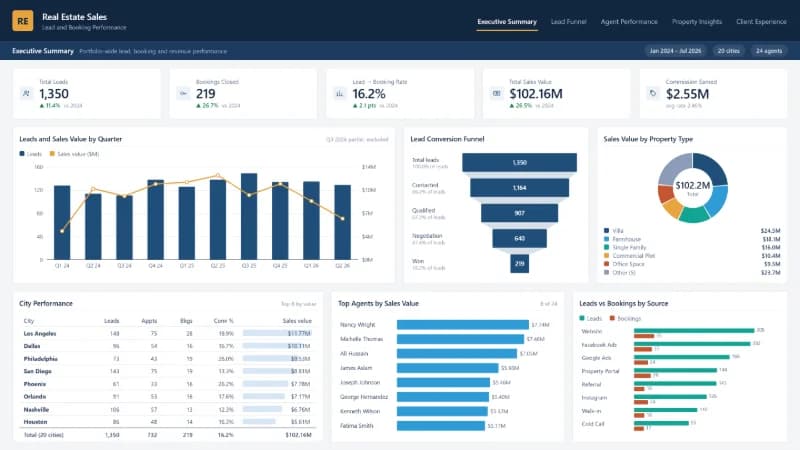
Pipeline Overview
Lead volume, conversion and signed value
How many leads come in, how many sign, and what are they worth?
- $236.5M proposal value quoted
- 347 contracts signed at a 26.7% win rate
- 209 systems installed, 16.1% of leads
PAGE 02
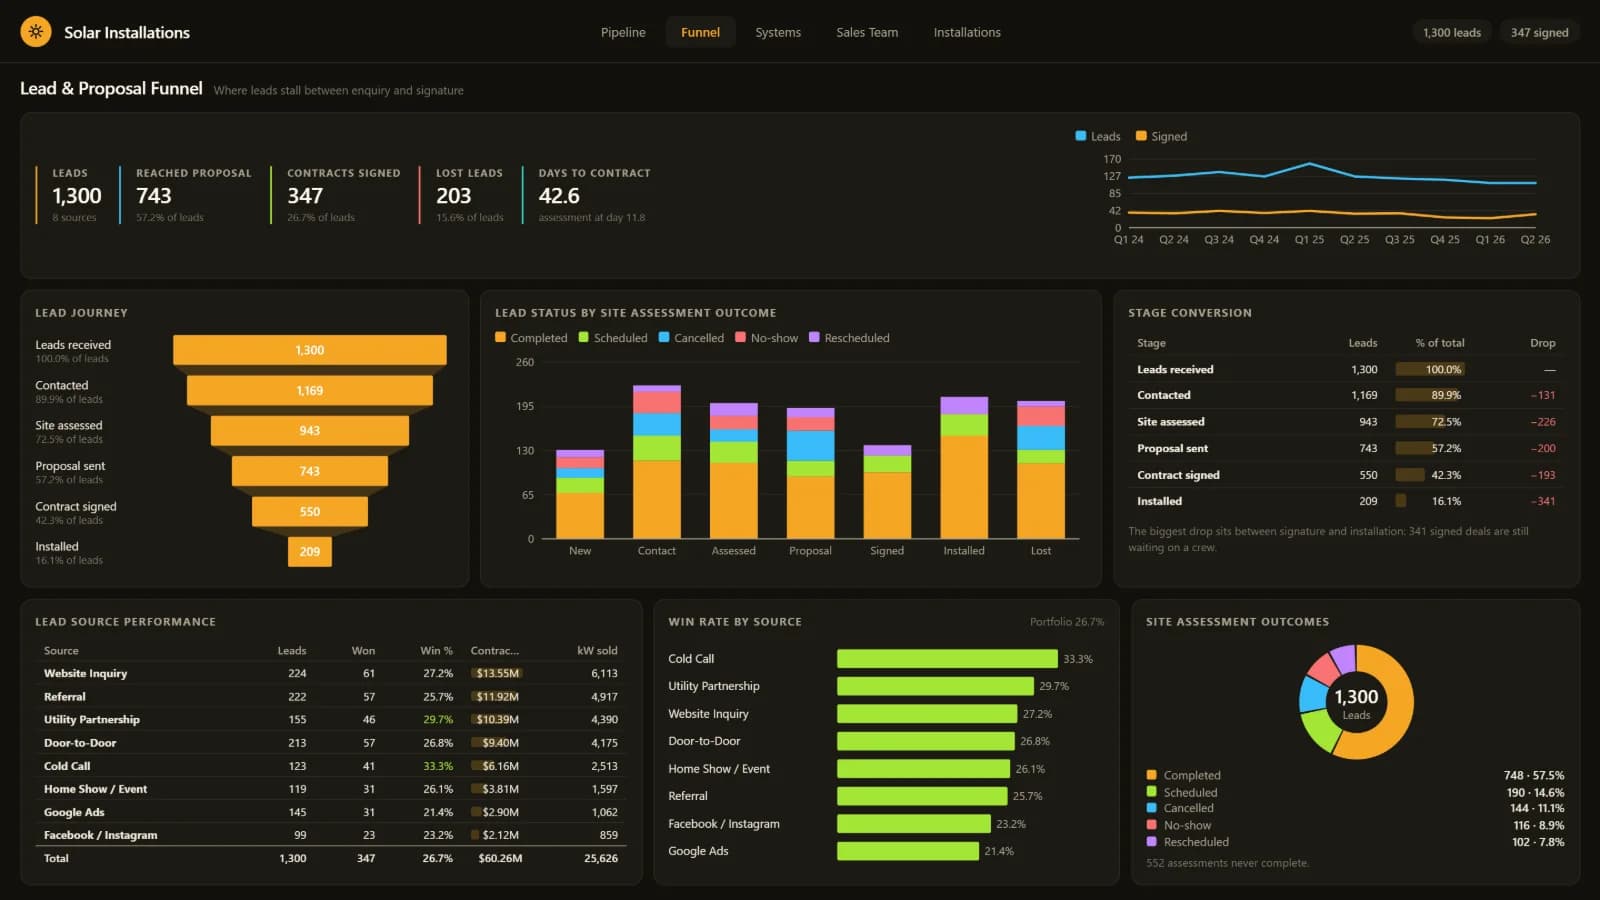
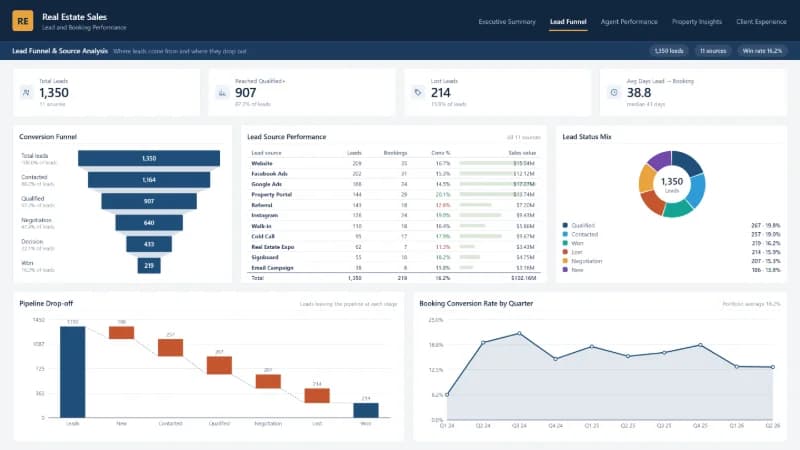
Lead & Proposal Funnel
Where leads stall between enquiry and signature
Where do leads stall between the first enquiry and a signed contract?
- 1,169 leads contacted, 89.9% of the total
- 743 received a proposal, 57.2% of leads
- $13.55M signed from website inquiries, the top source
PAGE 03
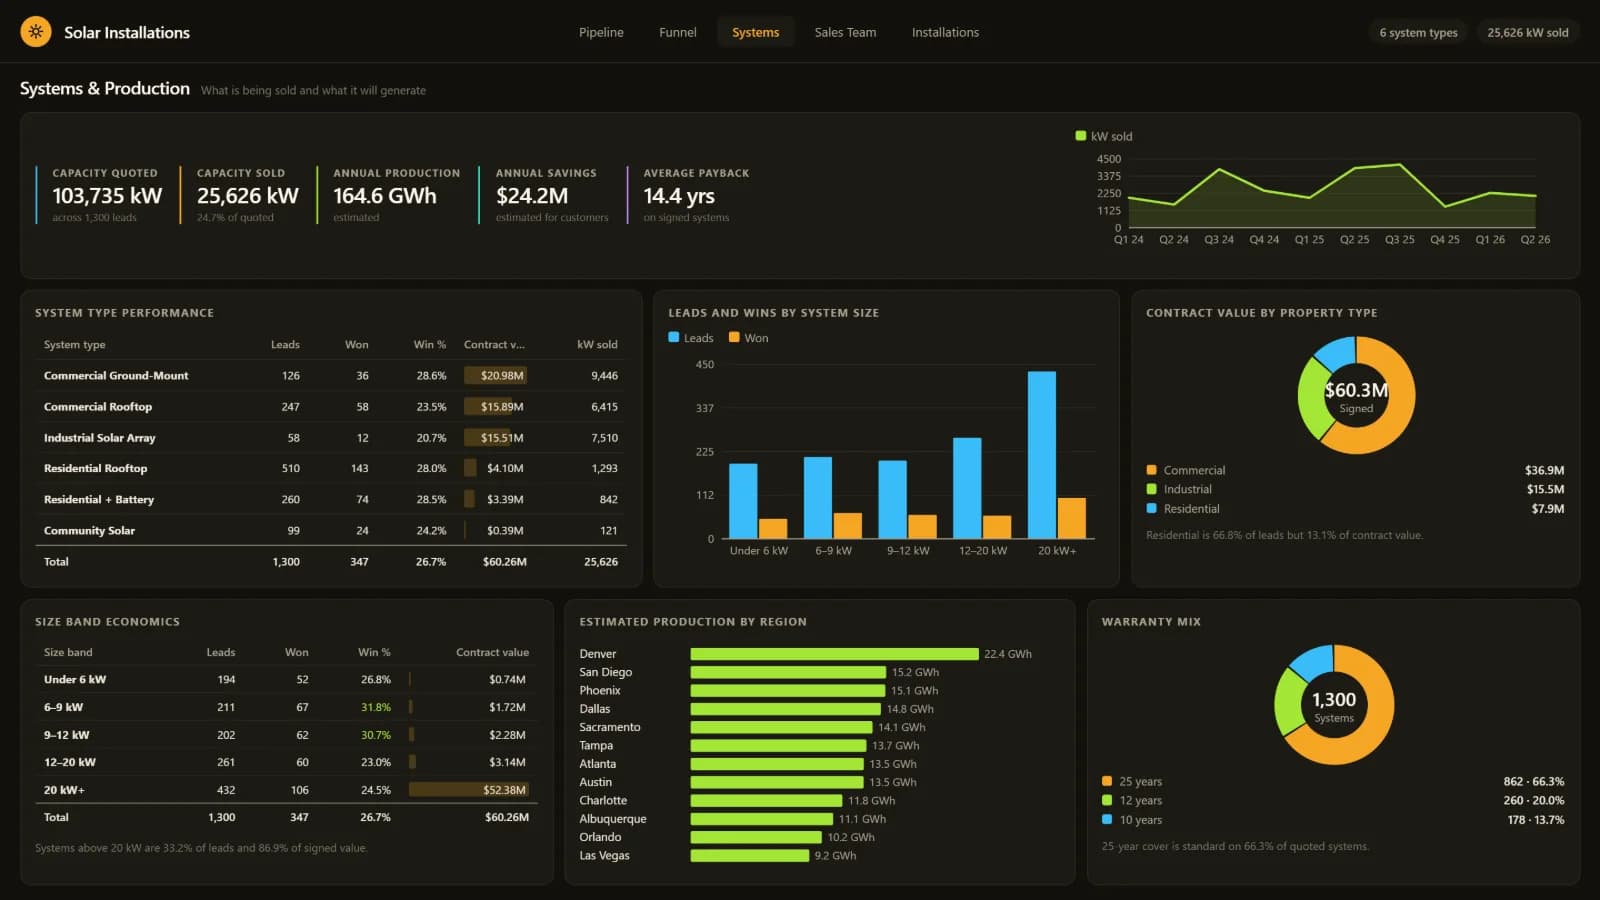
Systems & Production
What is being sold and what it will generate
What are customers buying, and what will those systems generate?
- 25,626 kW sold across 6 system types
- 103,735 kW quoted in proposals
- $21.0M from commercial ground-mount, the largest type
PAGE 04
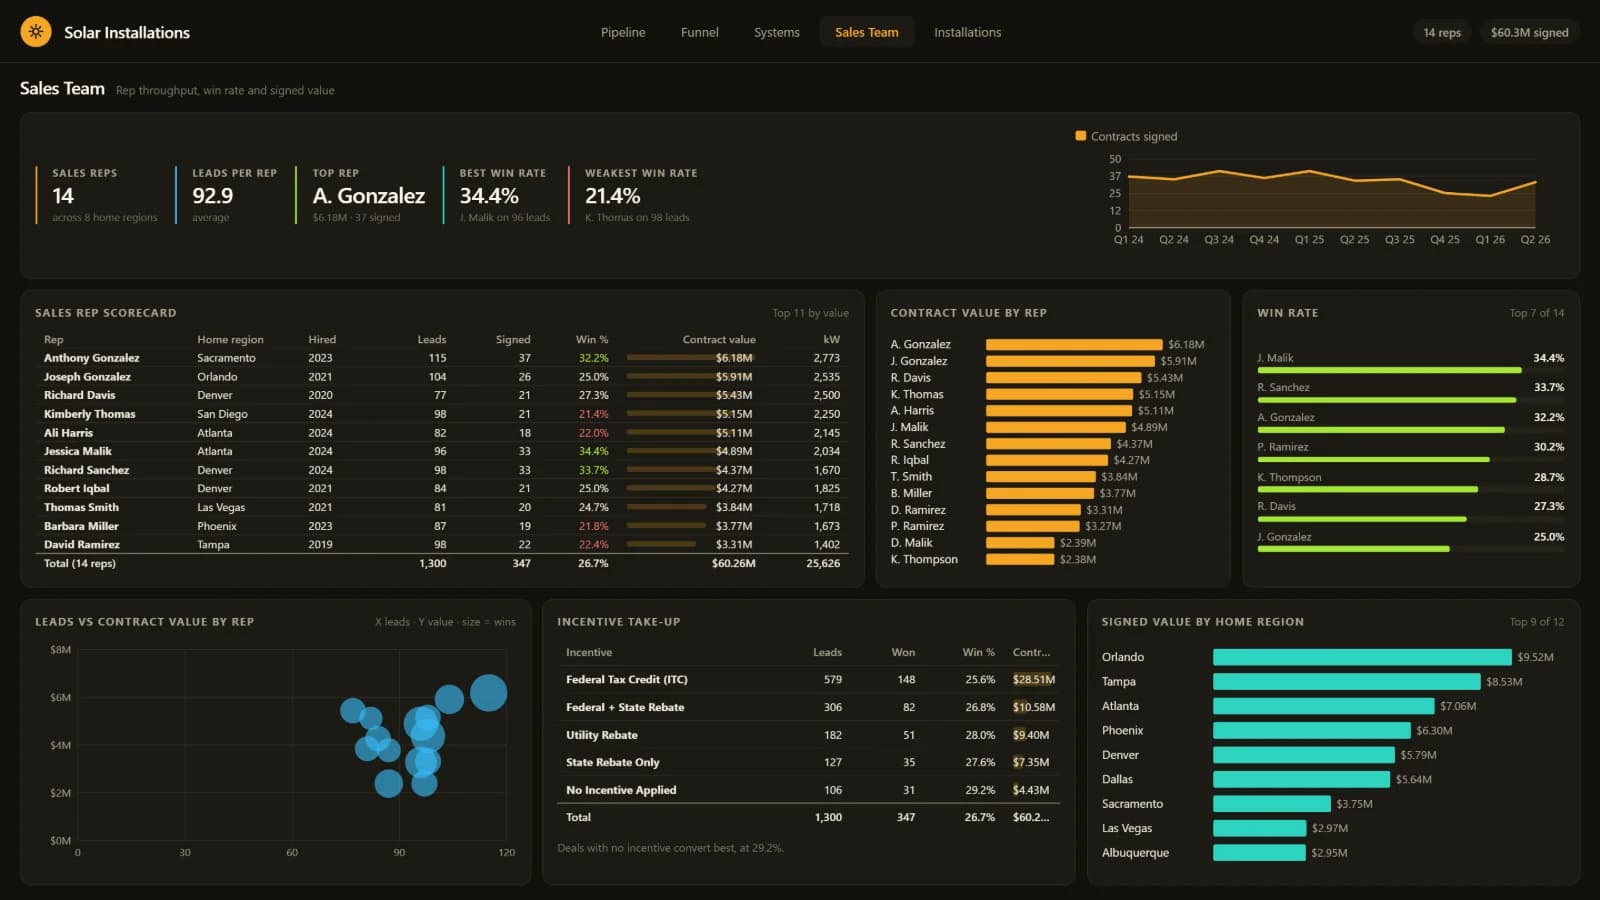
Sales Team
Rep throughput, win rate and signed value
Which reps and regions turn leads into signed contracts?
- 14 sales reps
- $60.3M signed contract value
- 38.0% win rate in Orlando, the best region
PAGE 05
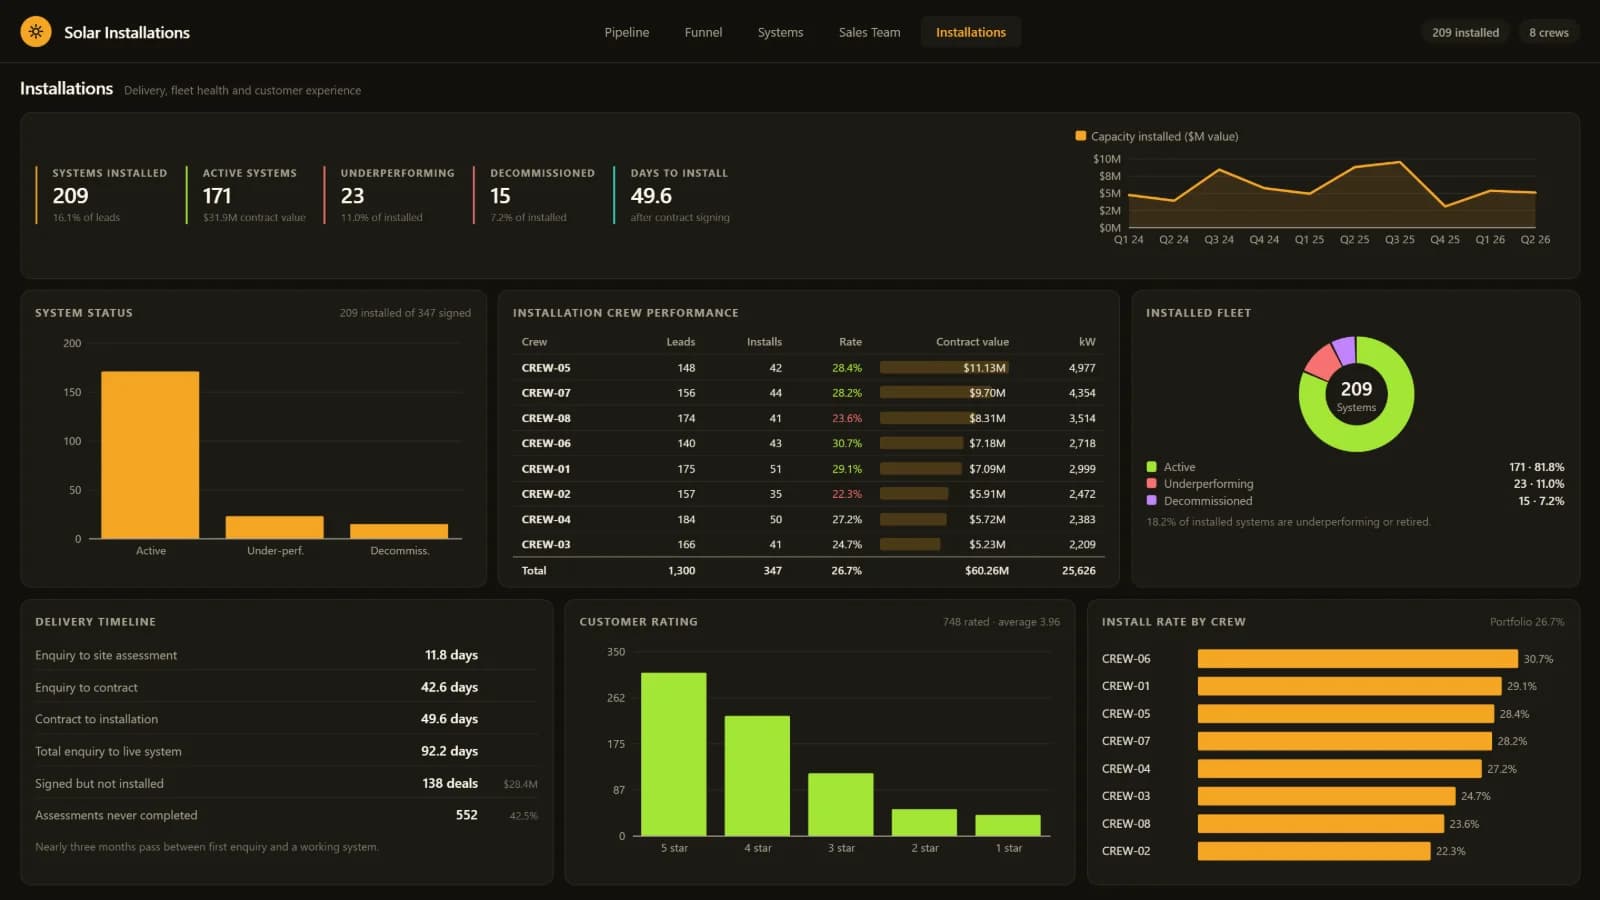
Installations
Delivery, fleet health and customer experience
Are signed systems being installed on time and performing afterwards?
- 209 systems installed
- 8 install crews
- 28.7% win rate on cash purchases, the best financing type
What the report surfaced
Figures the energy report puts in front of the leadership team every week.
- 1,300 leads produced $236.5M of quoted proposal value and 347 signed contracts worth $60.3M — a 26.7% win rate.
- The funnel narrows from 1,169 leads contacted (89.9%) to 743 proposals (57.2%) to 209 installed systems (16.1% of all leads).
- 25,626 kW was sold from 103,735 kW quoted, with commercial ground-mount the largest type at $21.0M.
- Orlando converts best at a 38.0% win rate across 14 reps and 12 regions, and cash purchases convert best of the financing types at 28.7%.
Want a report like this for your business?
Tell us the decision you need to get right. We'll show you what the data can answer in a free 30-minute call.