
HOME / WORK / LENDING PORTFOLIO
CASE STUDY · FINANCE
Lending Portfolio
LOAN ORIGINATION AND CREDIT PERFORMANCE
Tracks 1,350 loan applications through underwriting, pricing and repayment, alongside branch and officer performance and the live state of the loan book.
APPLICATIONS
1,350
Jan 2024 – Jul 2026
APPROVED VALUE
$66.54M
516 approvals
APPROVAL RATE
38.2%
up 1.8 pts vs 2024
DISBURSED VALUE
$44.13M
345 loans funded
WALK THE REPORT
Five pages, one question each
Each page answers one question the leadership team asks every week. Pick a page to see it full size.
THE QUESTION
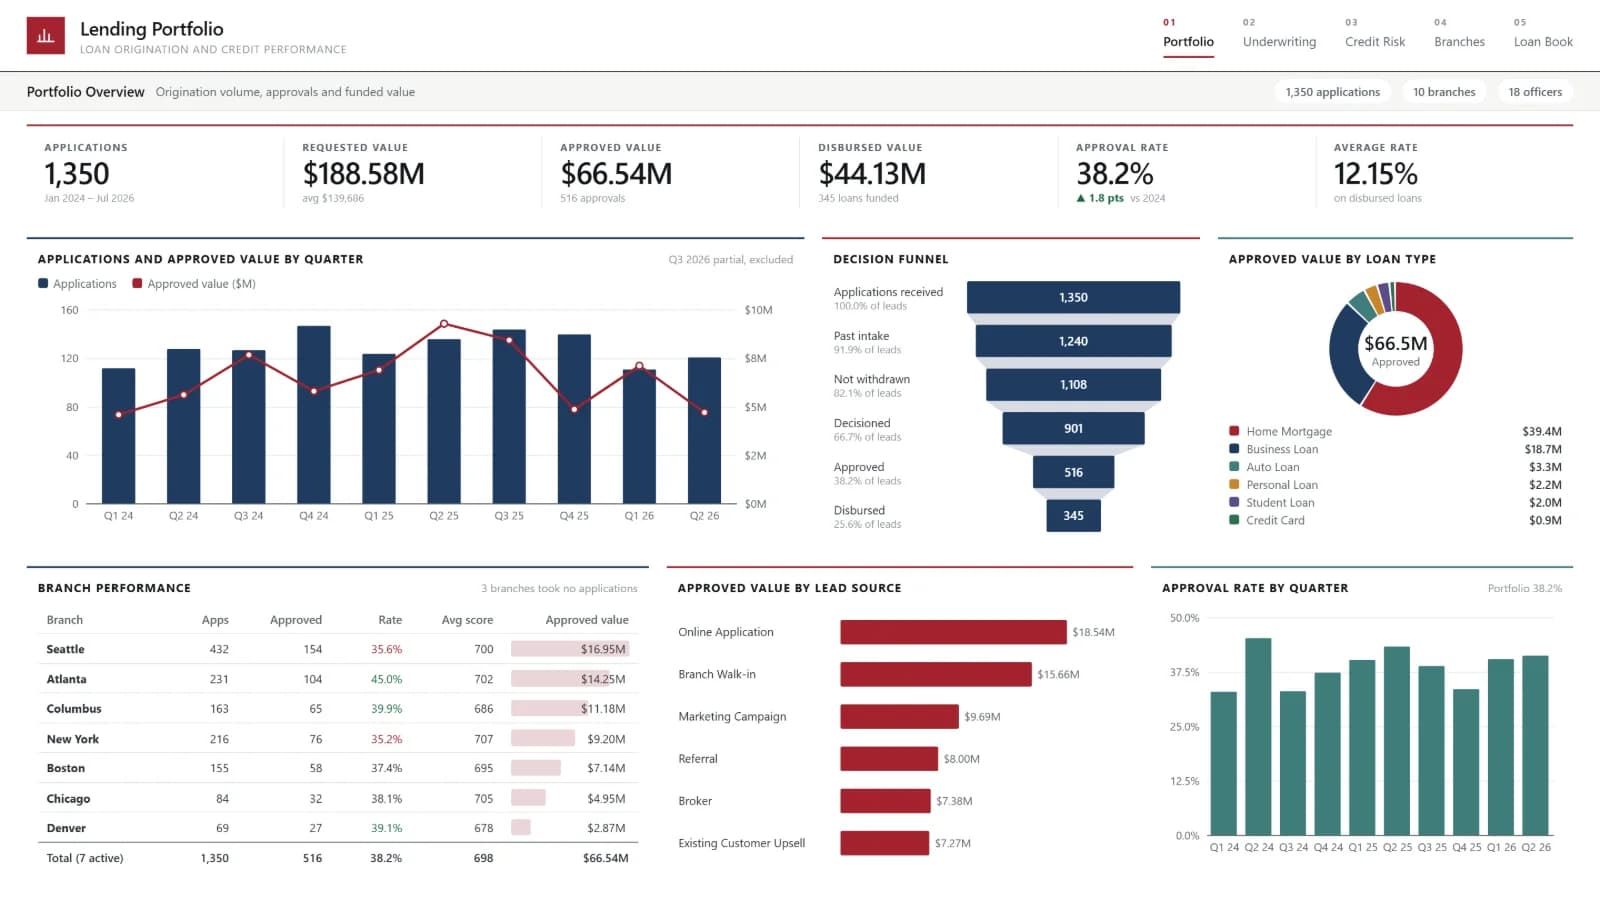
How much is being requested, approved and actually funded?
$188.58M
requested across 1,350 applications
$66.54M
approved from 516 approvals
12.15%
average rate on disbursed loans
CONTEXT
Why a lender needs this report
Lending generates more reporting than most industries and less clarity than it should. Origination volumes come from the loan system, decision times from the underwriting queue, risk bands from the scoring model and arrears from servicing, each on its own timetable.
Leadership ends up with a monthly pack that describes the past and a credit committee that argues about the present. The questions underneath — how quickly applications get a decision, whether pricing reflects the risk being written, and which branches are actually converting — need all of that data in one place.
How the report is built
Five pages move an application from intake to a funded loan and then follow that loan through repayment: portfolio overview, underwriting and decisions, credit risk and pricing, branch and officer performance, and the live loan book.
Applications, decisions, disbursements and repayments are modeled on one timeline, so approval rates, decision speed, risk mix and arrears can all be cut by branch, officer, product and period from the same measures.
WHAT IT BRINGS TOGETHER
- Loan applications and requested amounts
- Underwriting decisions and timestamps
- Credit scores and risk bands
- Pricing and interest rates
- Branch and officer assignments
- Repayment, arrears and write-offs
WHO IT SUITS
Banks, credit unions and specialist lenders that need origination, credit risk and servicing in one view rather than three monthly packs.
PAGE BY PAGE
What each page of the lending portfolio report answers
PAGE 01
Portfolio Overview
Origination volume, approvals and funded value
How much is being requested, approved and actually funded?
- $188.58M requested across 1,350 applications
- $66.54M approved from 516 approvals
- 12.15% average rate on disbursed loans
PAGE 02
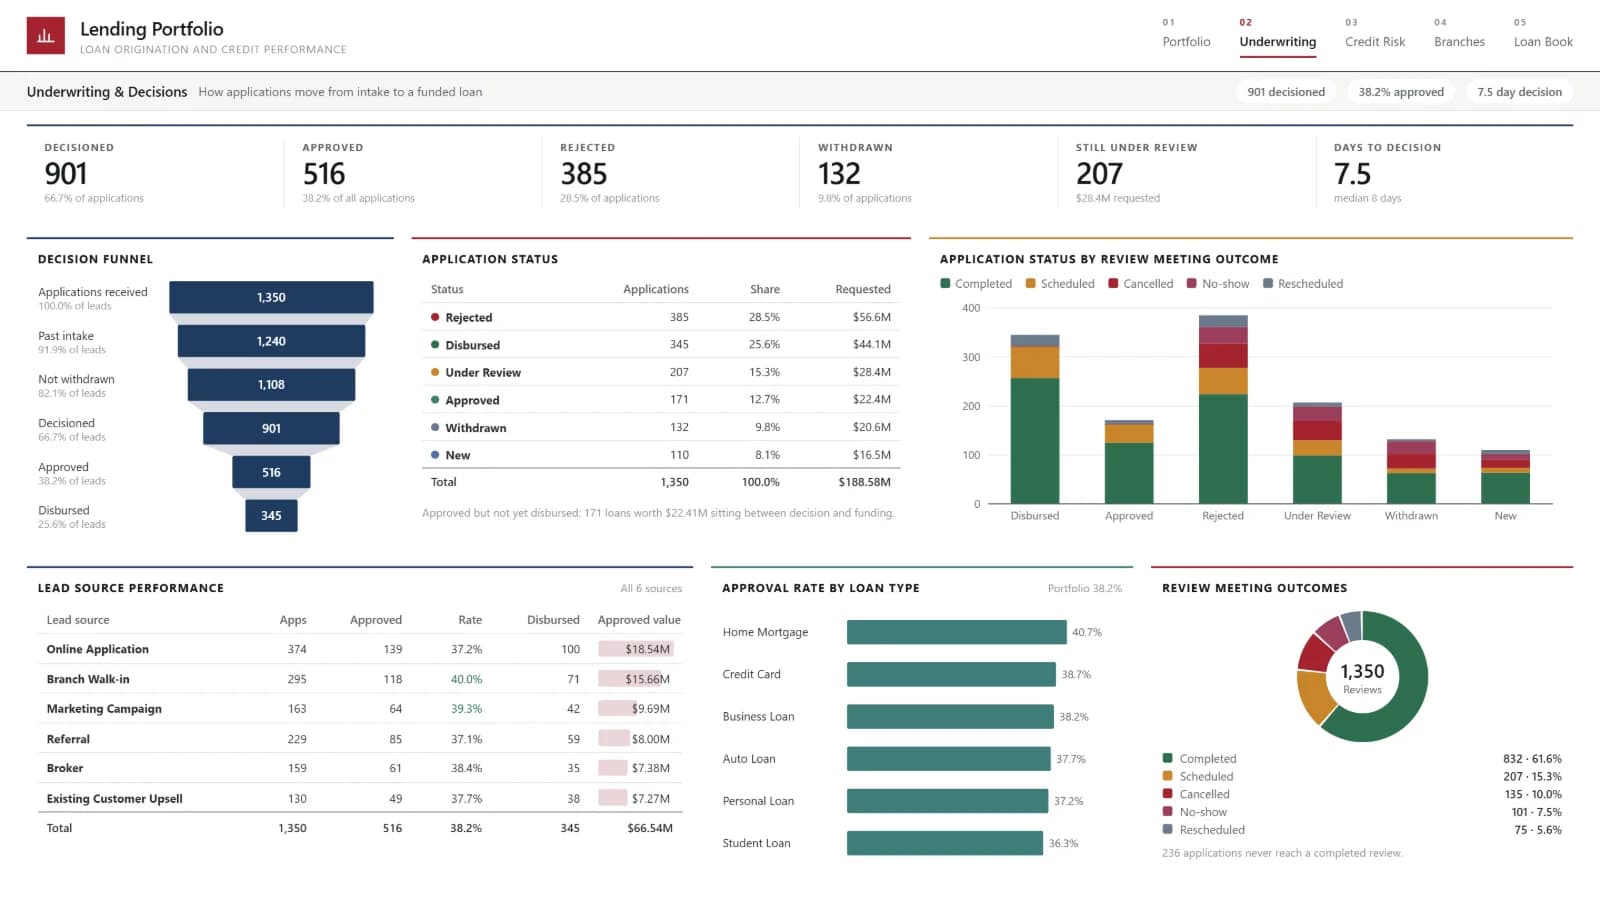
Underwriting & Decisions
How applications move from intake to a funded loan
How quickly do applications get a decision, and how many make it through?
- 901 applications decisioned
- 385 rejected, with 132 withdrawn
- 7.5 days on average to a decision
PAGE 03
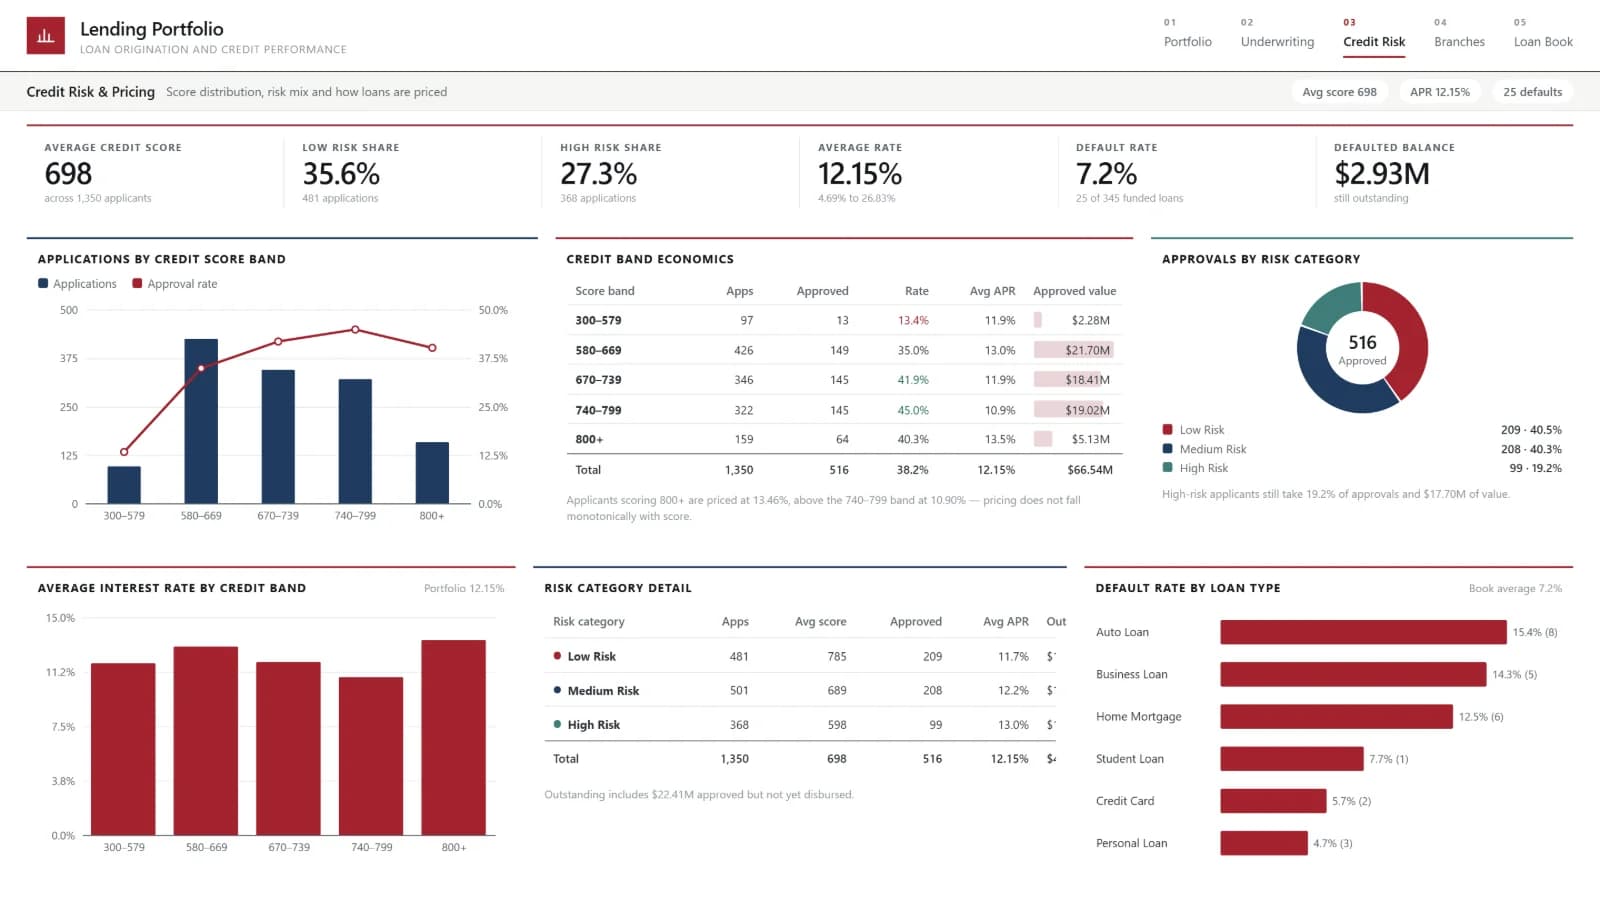
Credit Risk & Pricing
Score distribution, risk mix and how loans are priced
How risky is the book, and is pricing keeping up with that risk?
- 698 average credit score
- 27.3% of loans in the high-risk band
- 7.2% default rate, $2.93M defaulted balance
PAGE 04
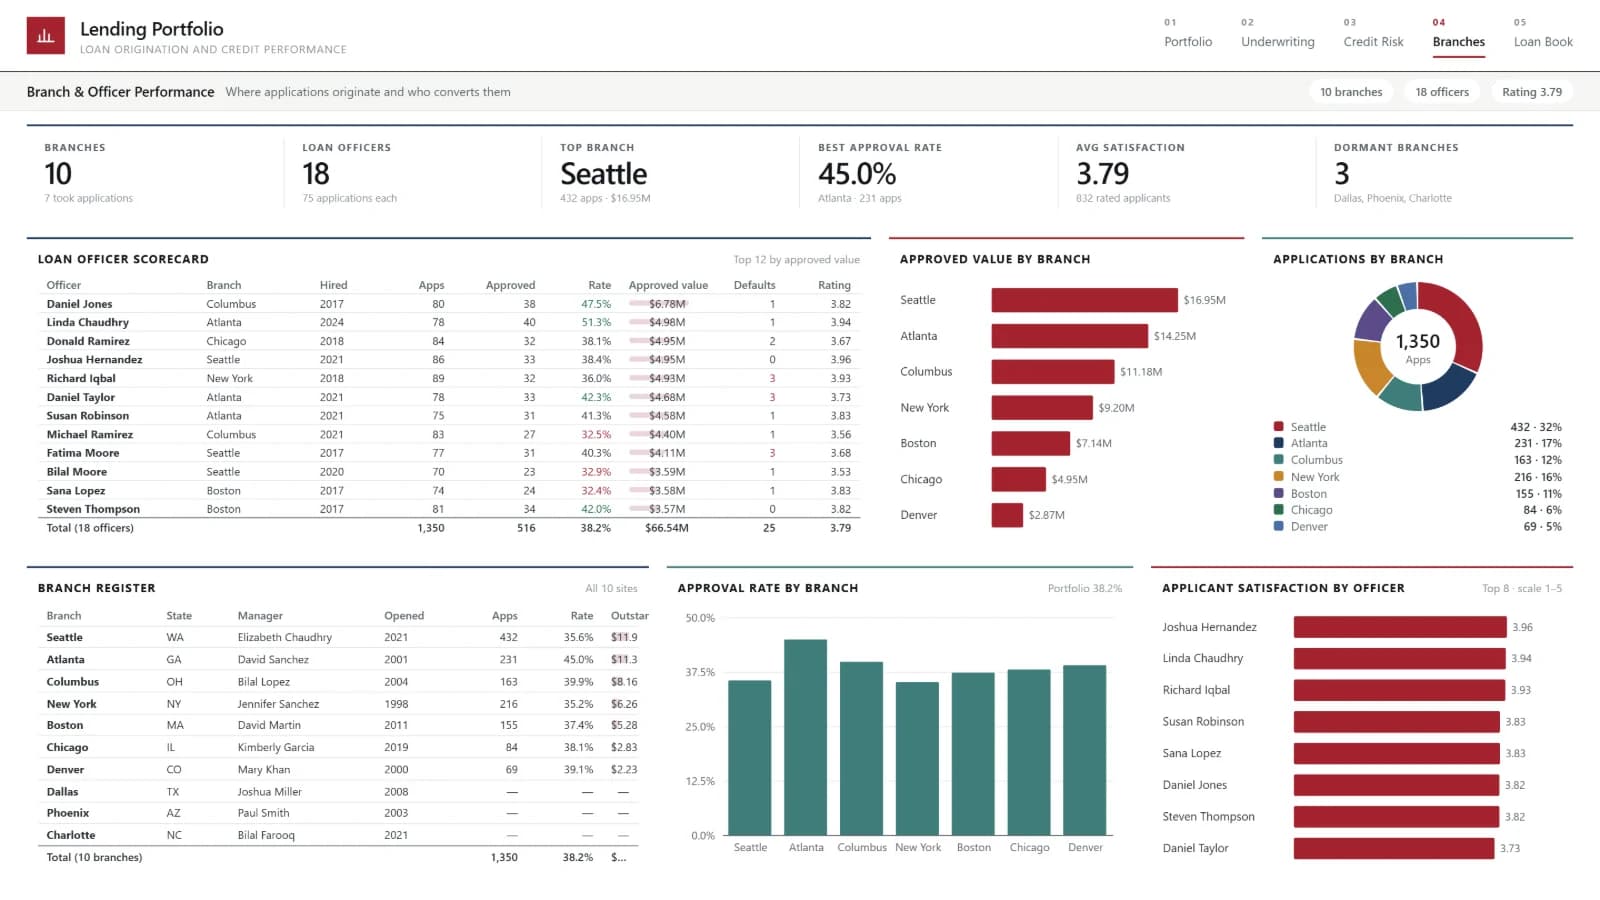
Branch & Officer Performance
Where applications originate and who converts them
Which branches and officers bring in applications, and who converts them?
- 432 applications from Seattle, the top branch
- 45.0% approval rate in Atlanta, the best branch
- 3 branches took no applications
PAGE 05
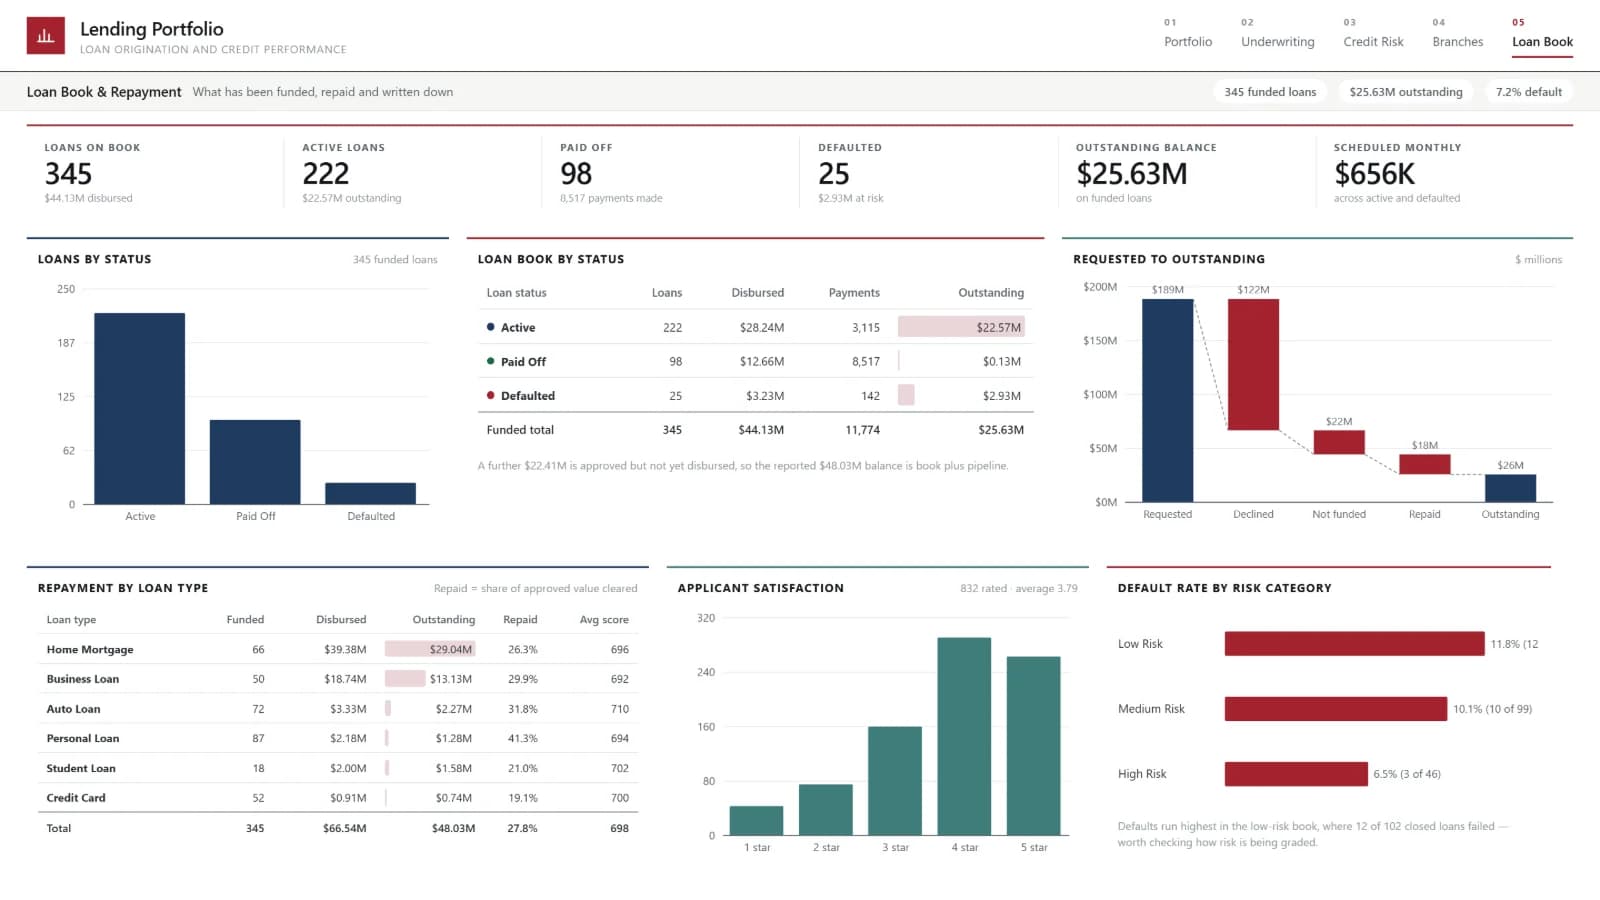
Loan Book & Repayment
What has been funded, repaid and written down
What is on the book today, and how is it being repaid?
- 345 loans on book, 222 active
- 98 paid off, with 25 defaulted
- $25.63M outstanding, $656K due each month
What the report surfaced
Figures the finance report puts in front of the leadership team every week.
- $188.58M was requested across 1,350 applications, $66.54M was approved from 516 approvals, and $44.13M was disbursed across 345 loans.
- The approval rate is 38.2%, up 1.8 points on 2024, with decisions taking 7.5 days on average across 901 decisioned applications.
- The average credit score is 698, 27.3% of loans sit in the high-risk band, and the default rate is 7.2% on a $2.93M defaulted balance.
- Seattle brings in the most applications at 432 while Atlanta approves the highest share at 45.0% — and three branches took no applications at all.
- $25.63M is outstanding on the book today, with $656K due each month across 222 active loans.
Want a report like this for your business?
Tell us the decision you need to get right. We'll show you what the data can answer in a free 30-minute call.