
HOME / WORK / CONSTRUCTION PROJECTS
CASE STUDY · CONSTRUCTION
Construction Projects
BIDS, DELIVERY AND COST CONTROL
A five-page report that follows every job from first bid to final client rating: where bids come from, who wins them, how delivery is tracking, where the budget is going and how safely the work gets done.
BID VALUE SUBMITTED
$1.89B
1,250 bids
CONTRACT VALUE WON
$543.3M
356 projects
WIN RATE
28.5%
356 of 1,250 bids
INCIDENT-FREE
70.5%
251 of 356 projects
WALK THE REPORT
Five pages, one question each
Each page answers one question the leadership team asks every week. Pick a page to see it full size.
THE QUESTION
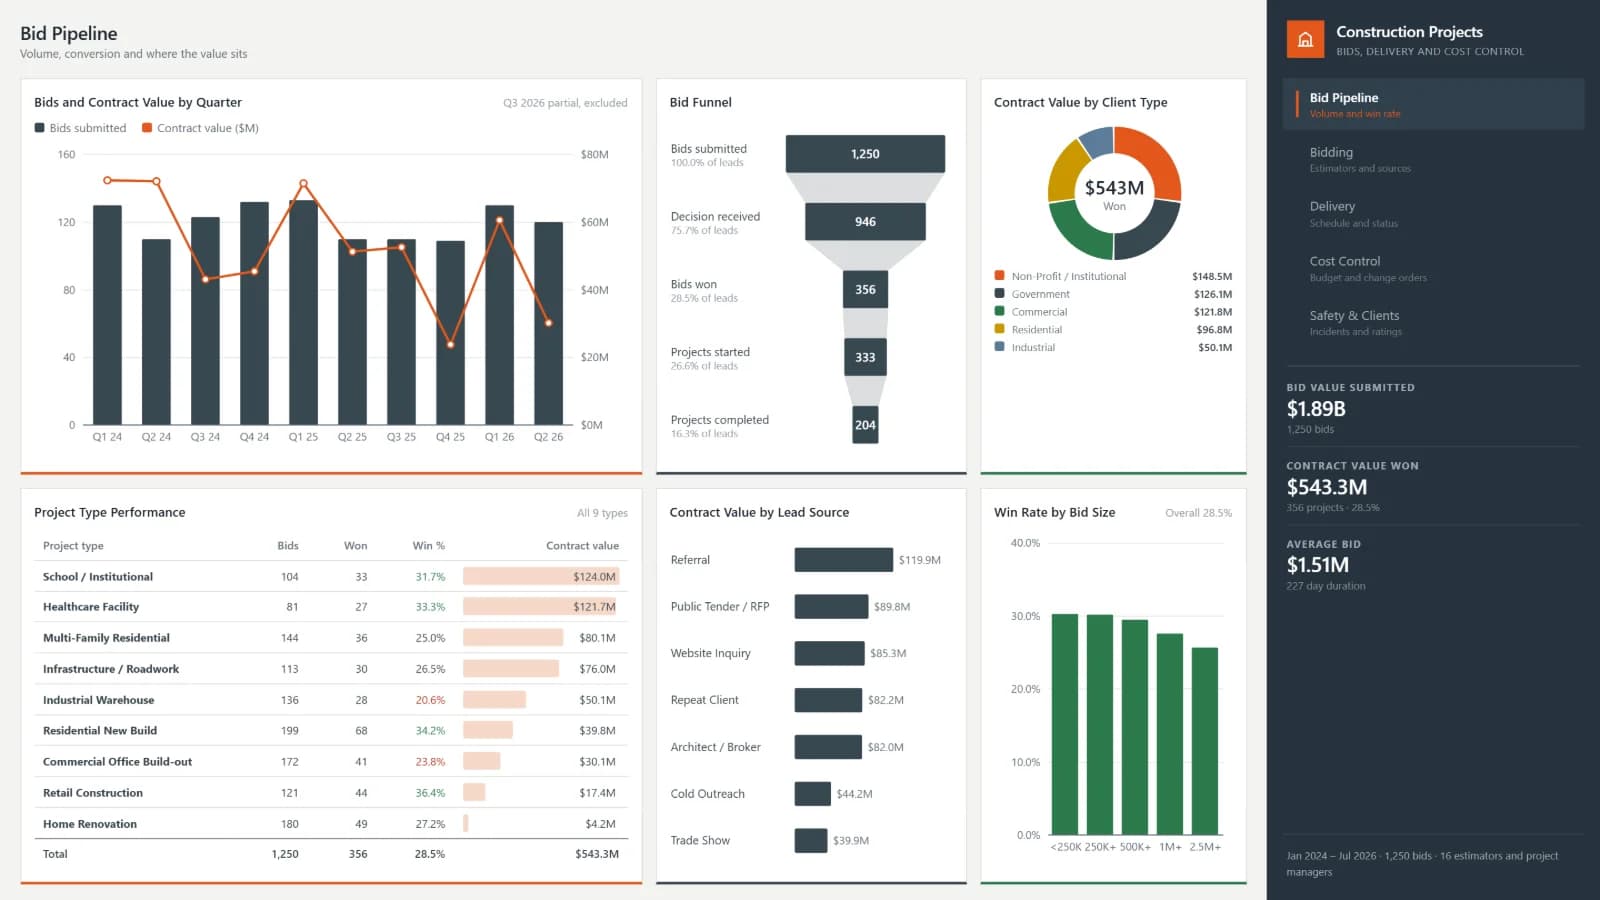
How much are we bidding, how much converts, and where does the won value sit?
$1.89B
bid value submitted across 1,250 bids
$543.3M
contract value won from 356 projects
16.3%
of leads make it all the way to completed
CONTEXT
Why a contractor needs this report
A contractor's numbers are spread across the systems that produced them. Bids sit with the estimating team, awarded work moves into project management, costs land in accounting weeks later, and safety records live in a separate log. Each team can answer for its own stage, and nobody can answer for the job end to end.
That gap shows up in the questions leadership asks most often and answers slowest: which lead sources are worth chasing, whether the awarded book is being delivered on schedule, how much of the contract value has already been spent, and how much cash is sitting in unpaid invoices. This report answers all four from one model.
How the report is built
Five pages, each answering one question a construction leadership team asks every week: what is in the bid pipeline, which estimators and sources convert, whether delivery is on schedule, where the budget is going, and how safely the work is done.
Bid, project, cost and safety records are modeled against a shared project key, so a job can be followed from first enquiry to final client rating without anyone reconciling exports by hand. Values refresh on a schedule, and the same model feeds the estimator and project-manager views.
WHAT IT BRINGS TOGETHER
- Bid and estimating records
- Awarded project schedules
- Cost and budget ledgers
- Change orders
- Invoicing and payments
- Safety incident logs
WHO IT SUITS
Contractors and construction groups running multiple bids and awarded projects at once, where estimating, delivery, cost and safety data currently live in separate systems.
PAGE BY PAGE
What each page of the construction projects report answers
PAGE 01
Bid Pipeline
Volume and win rate
How much are we bidding, how much converts, and where does the won value sit?
- $1.89B bid value submitted across 1,250 bids
- $543.3M contract value won from 356 projects
- 16.3% of leads make it all the way to completed
PAGE 02
Bidding
Estimators and sources
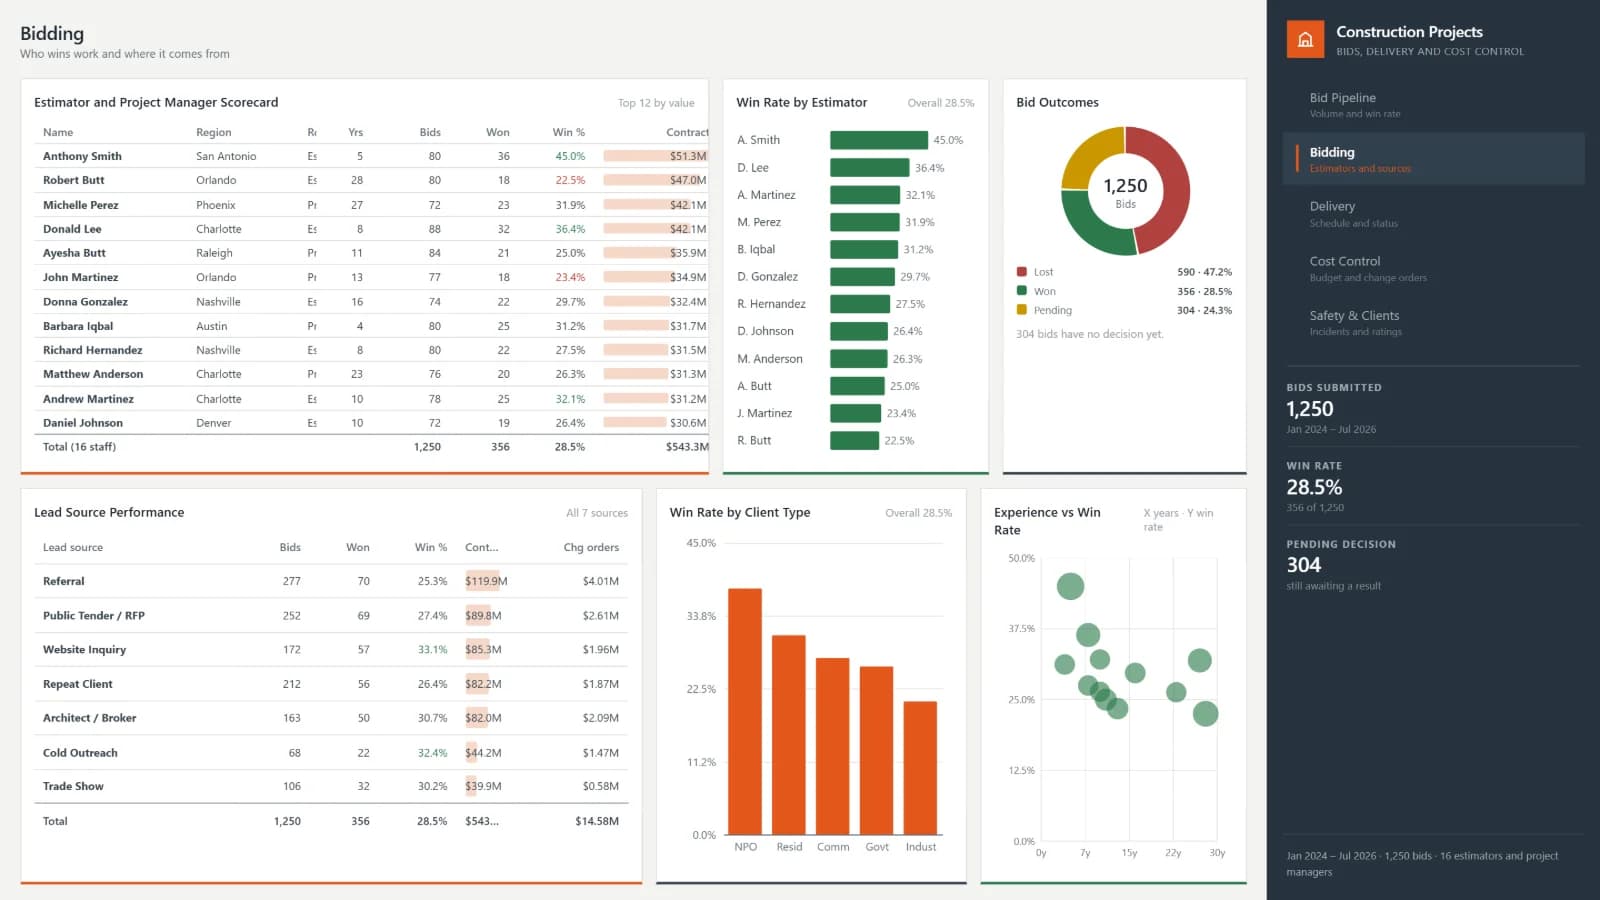
Which estimators win work, and which lead sources are worth chasing?
- 45.0% top estimator win rate, against 28.5% overall
- $119.9M won through referrals, the strongest source
- 304 bids still waiting on a decision
PAGE 03
Delivery
Schedule and status
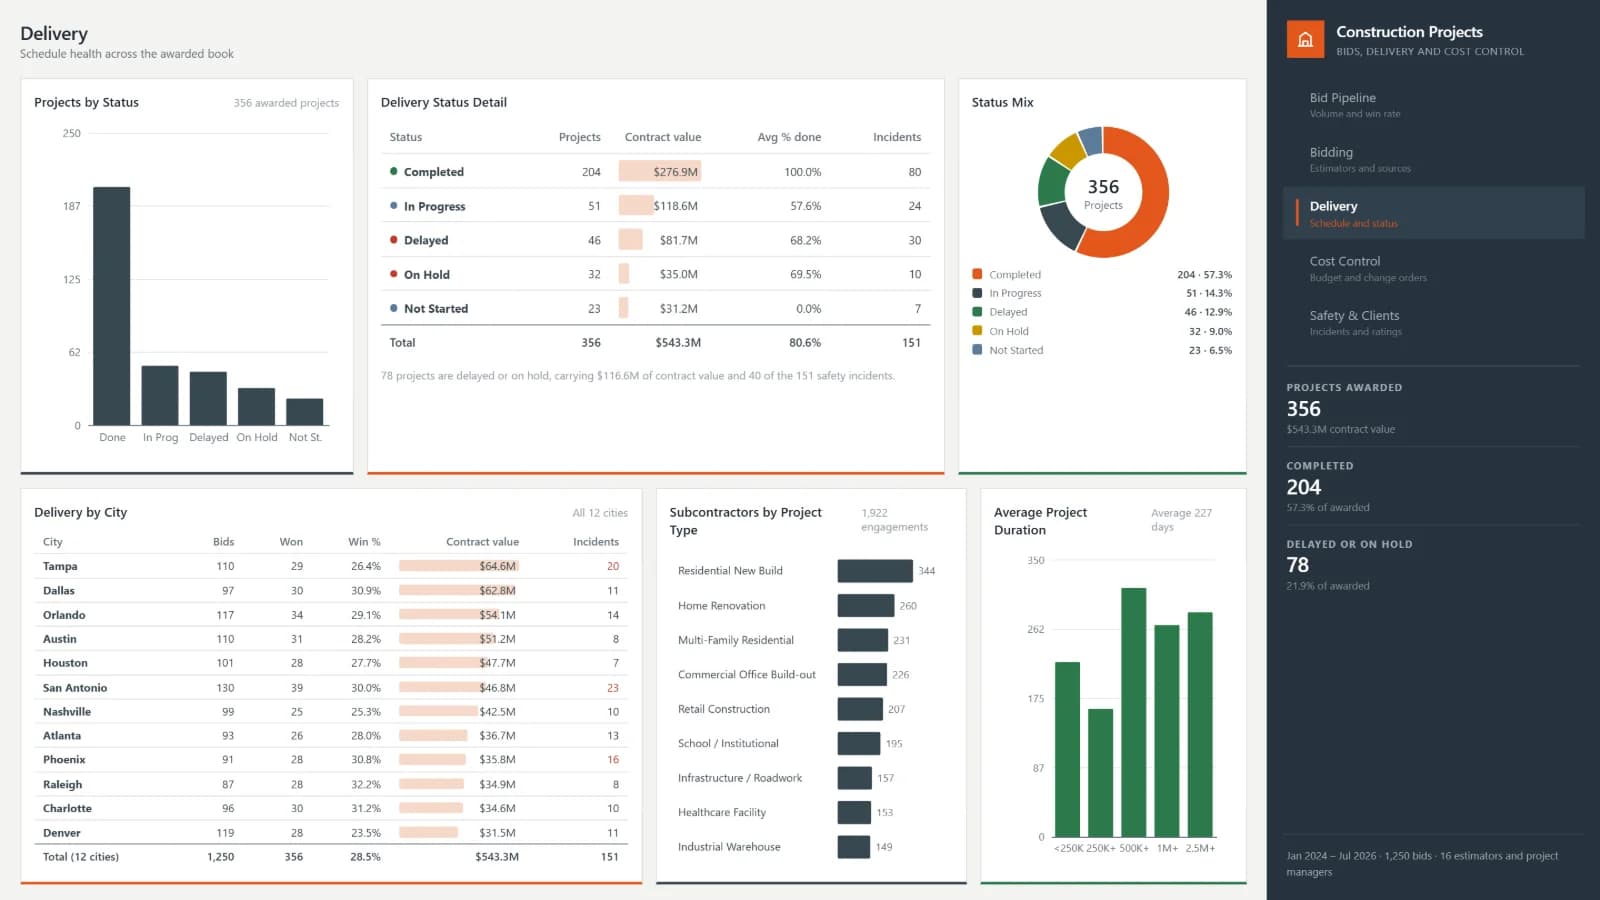
Is the awarded book being delivered on schedule, and where is it slipping?
- 204 projects completed, 57.3% of awarded
- 78 delayed or on hold, 21.9% of awarded
- $116.6M contract value tied up in those 78 jobs
PAGE 04
Cost Control
Budget and change orders
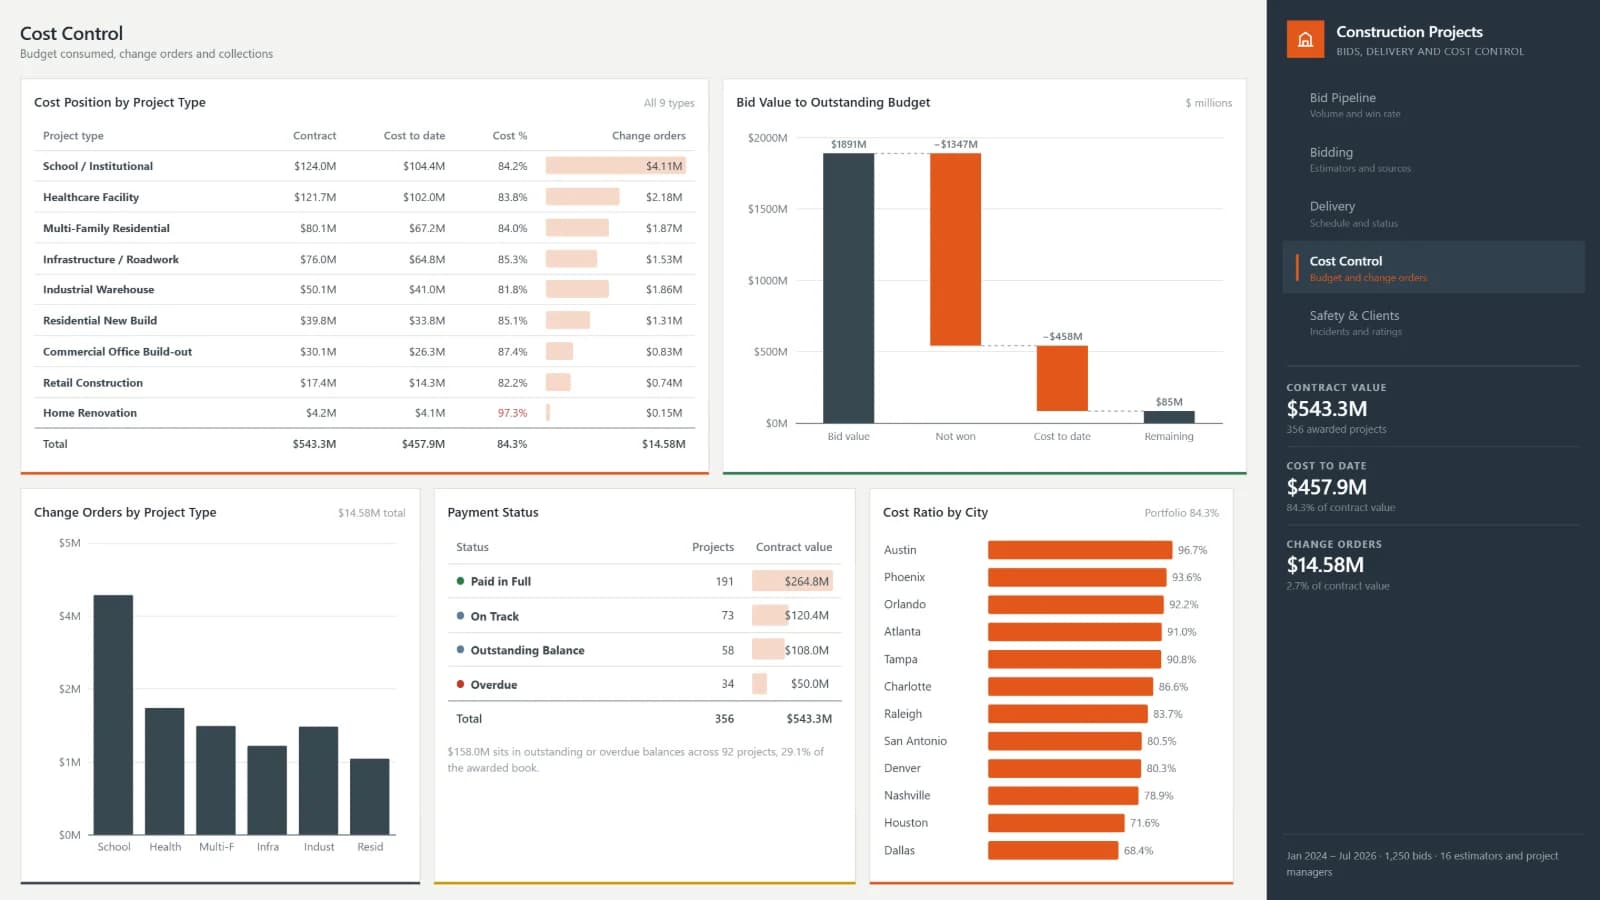
How much budget is consumed, and what is change-order and payment risk costing us?
- 84.3% of contract value spent to date ($457.9M)
- $14.58M in change orders, 2.7% of contract value
- $158.0M outstanding or overdue across 92 projects
PAGE 05
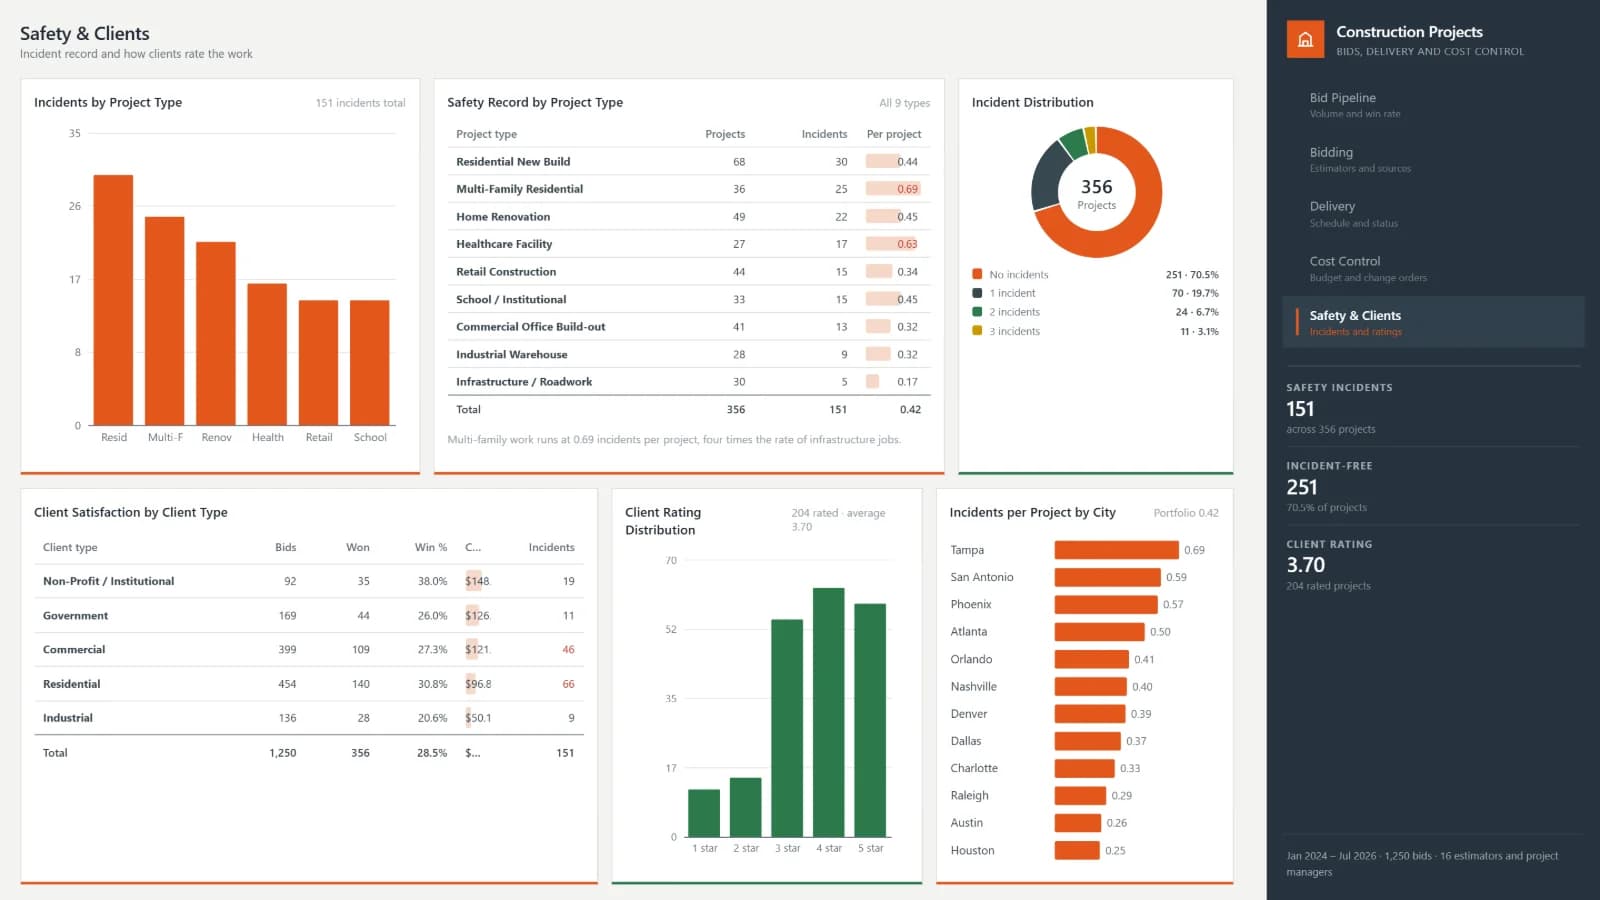
Safety & Clients
Incidents and ratings
How safely is the work done, and how do clients rate it afterwards?
- 70.5% of projects finished incident-free (251 of 356)
- 0.69 incidents per multi-family project, the highest type
- 3.70 average client rating across 204 rated projects
What the report surfaced
Figures the construction report puts in front of the leadership team every week.
- $1.89B of bid value submitted across 1,250 bids, converting to $543.3M of contract value on 356 projects — a 28.5% win rate.
- The top estimator wins 45.0% of bids against a 28.5% average, and referrals account for $119.9M of won work, the strongest single source.
- 78 awarded projects are delayed or on hold, tying up $116.6M of contract value, with 304 bids still awaiting a decision.
- 84.3% of contract value has been spent, $14.58M has gone through change orders, and $158.0M is outstanding or overdue across 92 projects.
- 70.5% of projects finished incident-free, and the 204 rated projects average 3.70 out of 5.
Want a report like this for your business?
Tell us the decision you need to get right. We'll show you what the data can answer in a free 30-minute call.