
HOME / WORK
OUR WORK
Nine reports, nine industries
Power BI reports for construction, energy, lending, property, retail, self storage, ecommerce and paid social. Each one is five pages, built around the questions its leadership team asks every week.
9
CASE STUDIES
45
REPORT PAGES
ABOUT THESE REPORTS
What a Stack Homme report looks like
Every report on this page was built for a business that already had the data and could not get an answer out of it. Bids sat in one system and costs in another; leads were counted in a CRM and revenue in a ledger; nine ad platforms each reported their own success in their own definitions. The work was not collecting more data. It was agreeing what the numbers mean and putting them in one place.
They span construction, energy, lending, property finance, real estate, retail, self storage, ecommerce and paid social, and they are published with identifying details removed. Different industries, one shape: five pages, each answering a question the leadership team asks every week, on a model that refreshes without anyone exporting a spreadsheet.
If your questions look like the ones on these pages, the build is likely to look similar too — and if they don't, the shape changes, not the approach. Read more about how we work in data analytics and Power BI, data engineering and data science.
Case studies
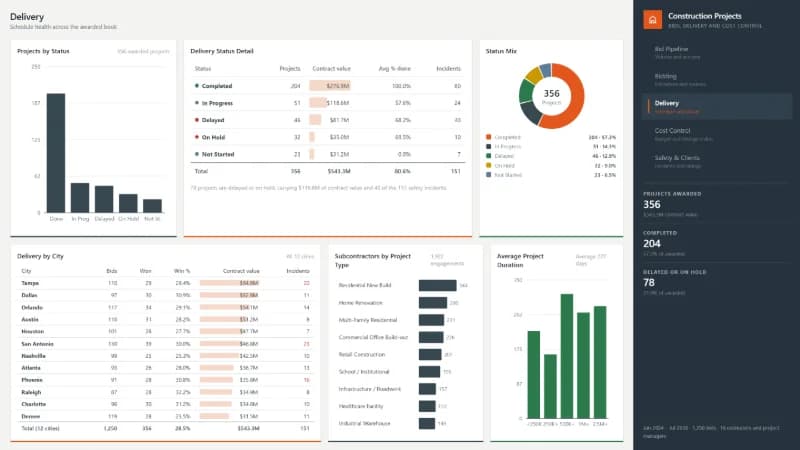
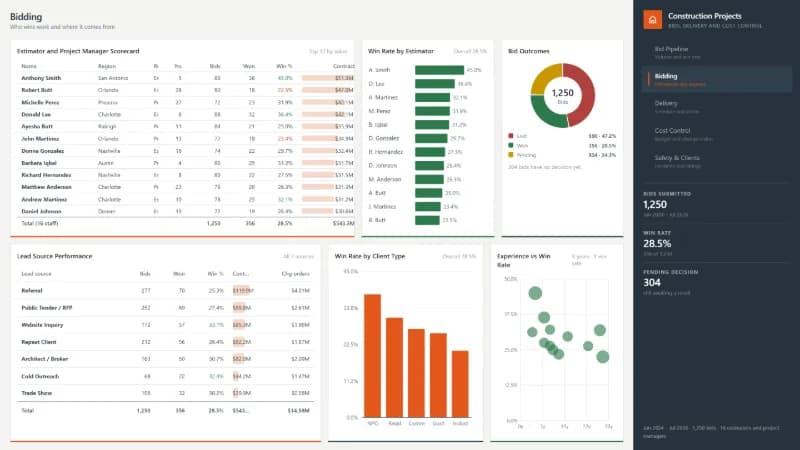
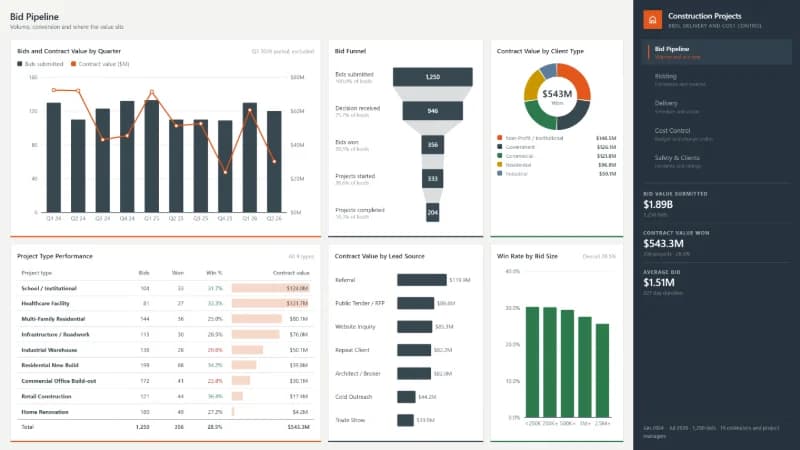
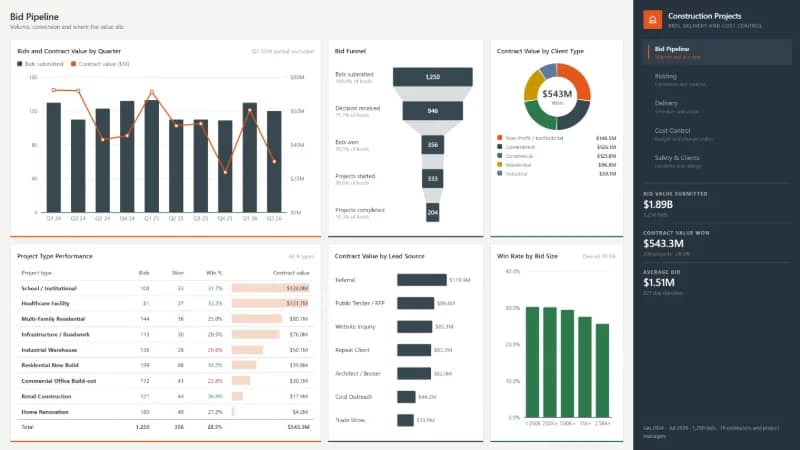
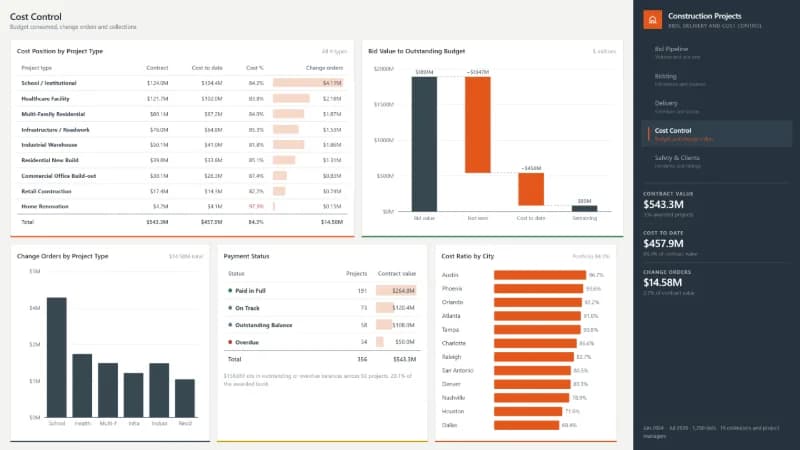
Construction Projects
BIDS, DELIVERY AND COST CONTROL
$1.89B
BID VALUE SUBMITTED
28.5%
WIN RATE
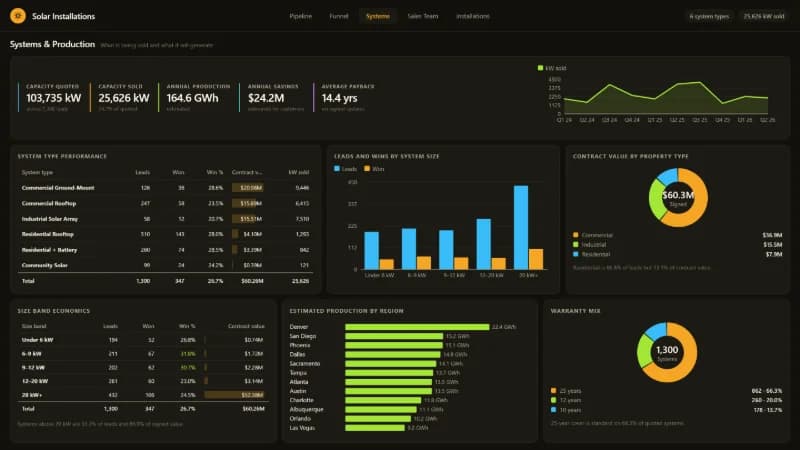
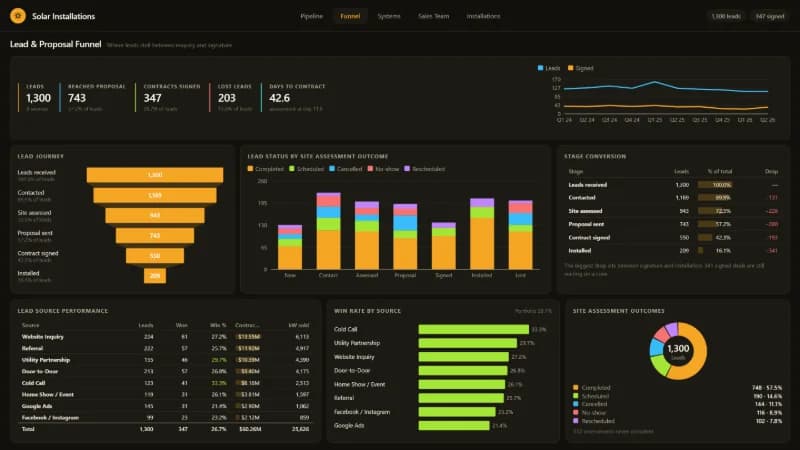
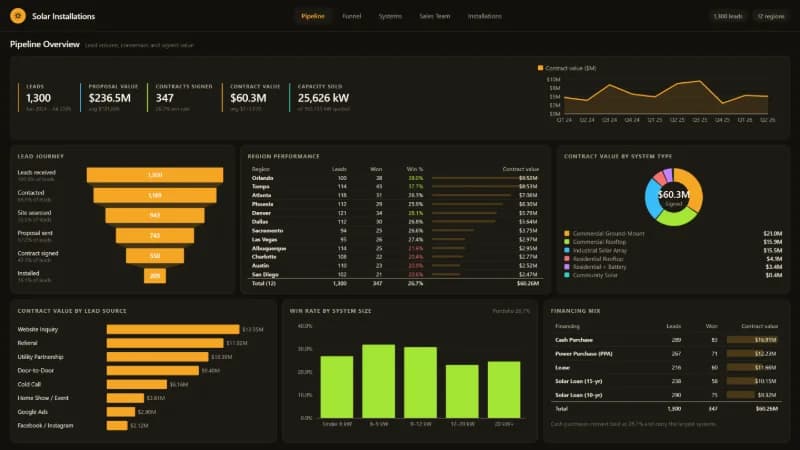
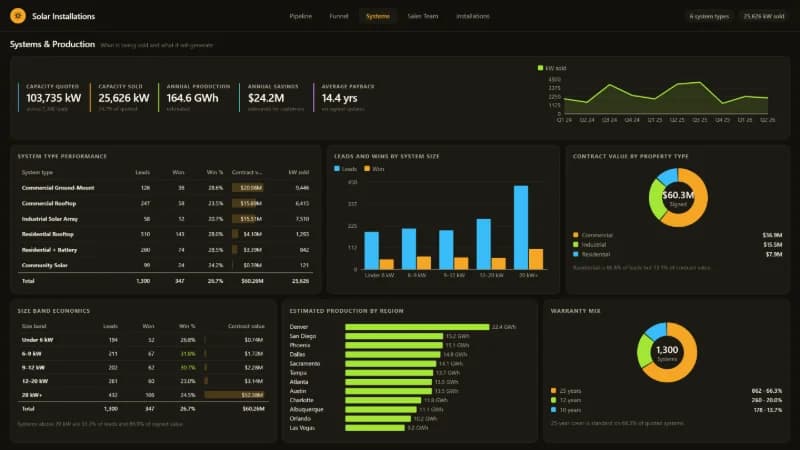
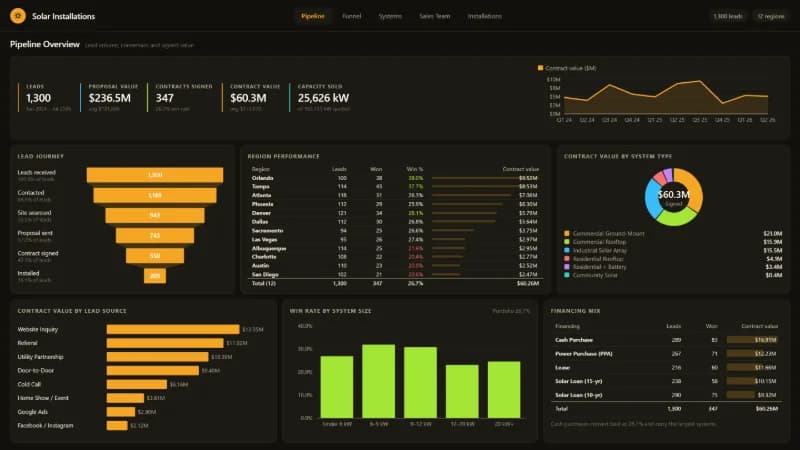
Solar Installations
LEAD TO INSTALL FOR A SOLAR SALES TEAM
1,300
LEADS
26.7%
WIN RATE
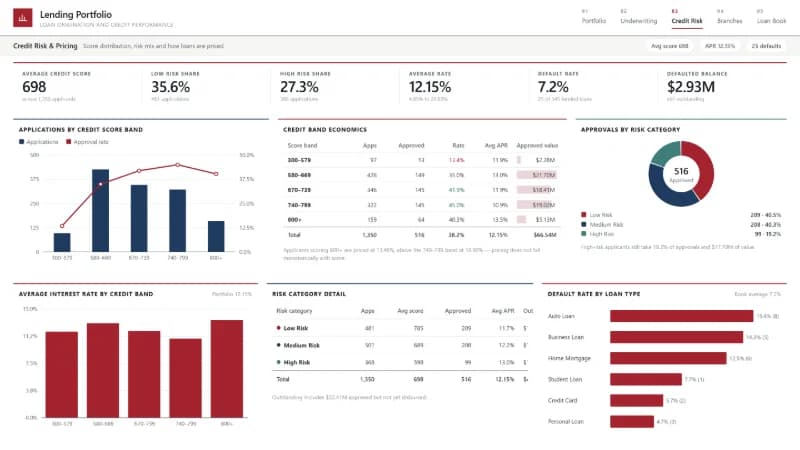
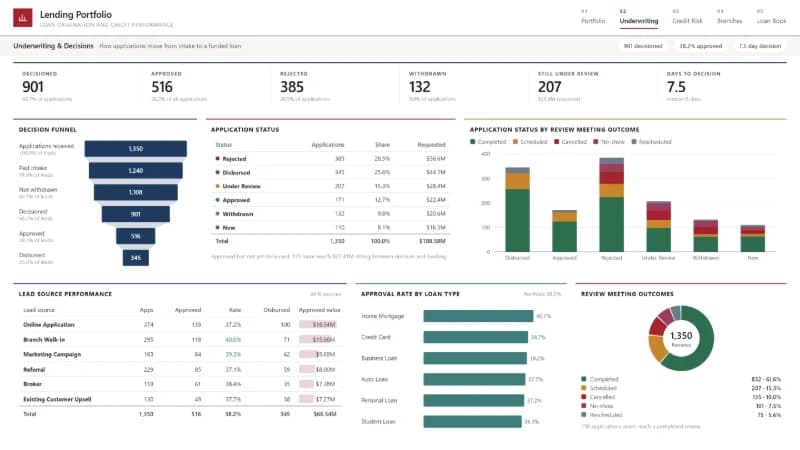
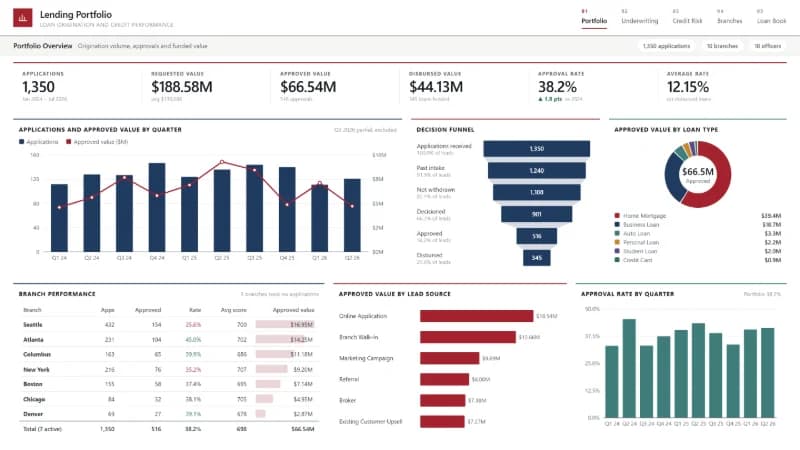
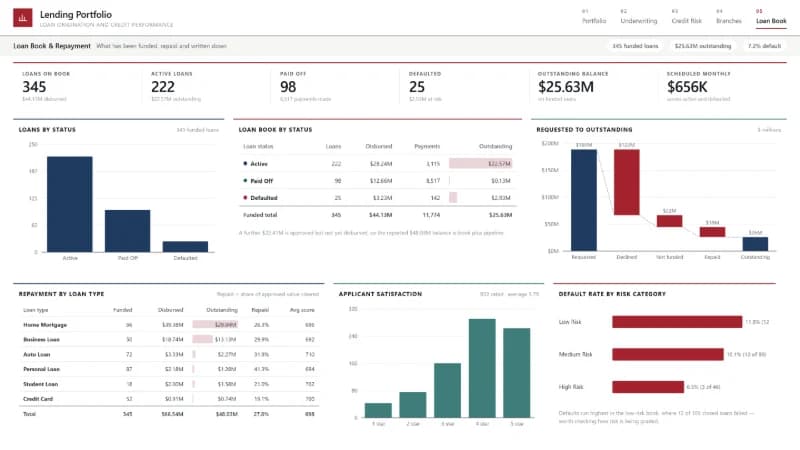
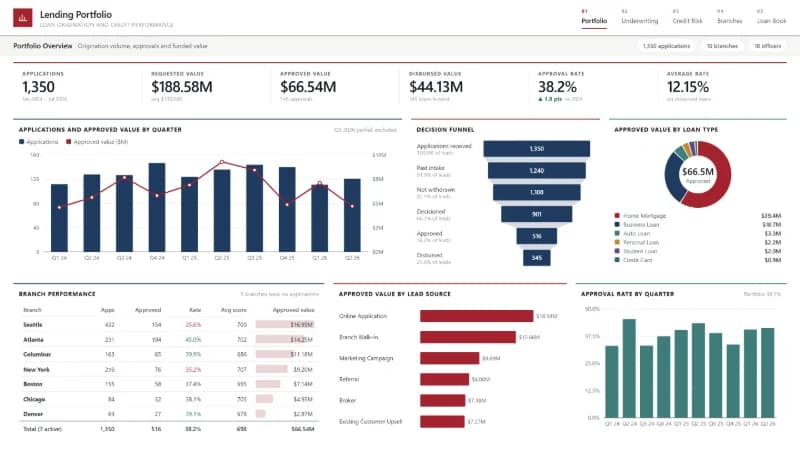
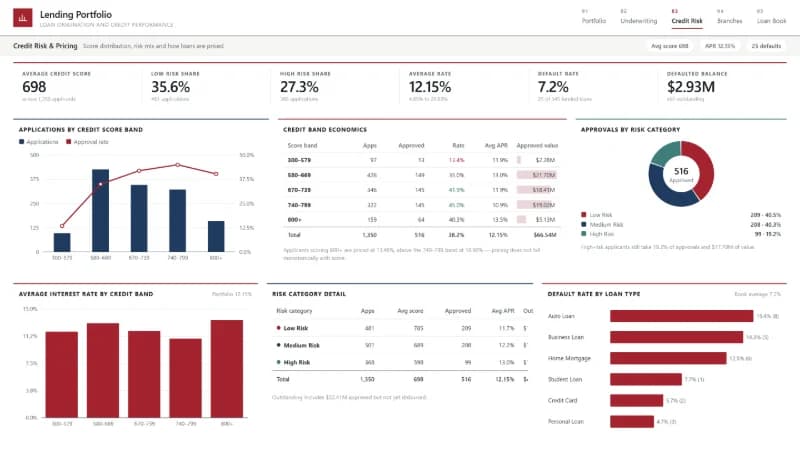
Lending Portfolio
LOAN ORIGINATION AND CREDIT PERFORMANCE
1,350
APPLICATIONS
38.2%
APPROVAL RATE
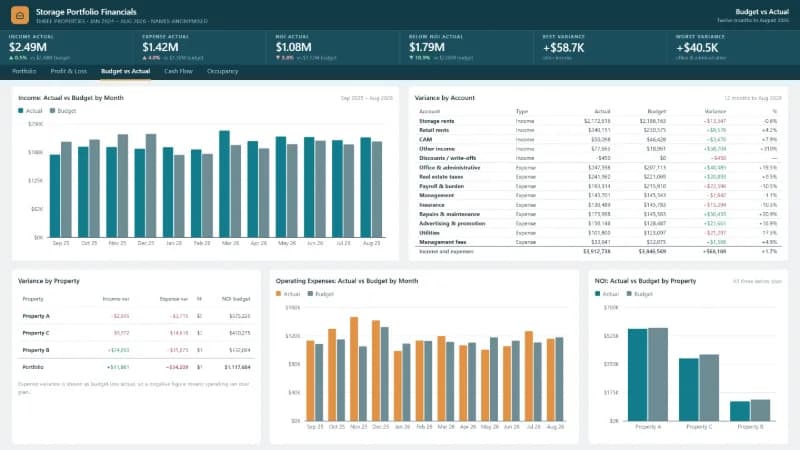
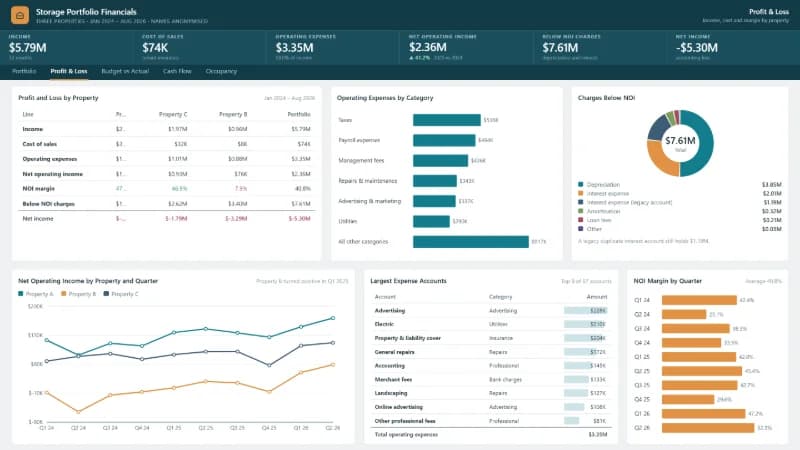
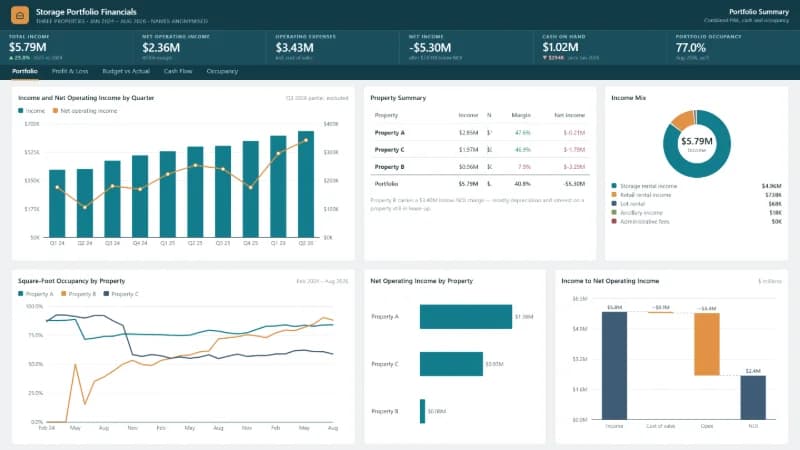
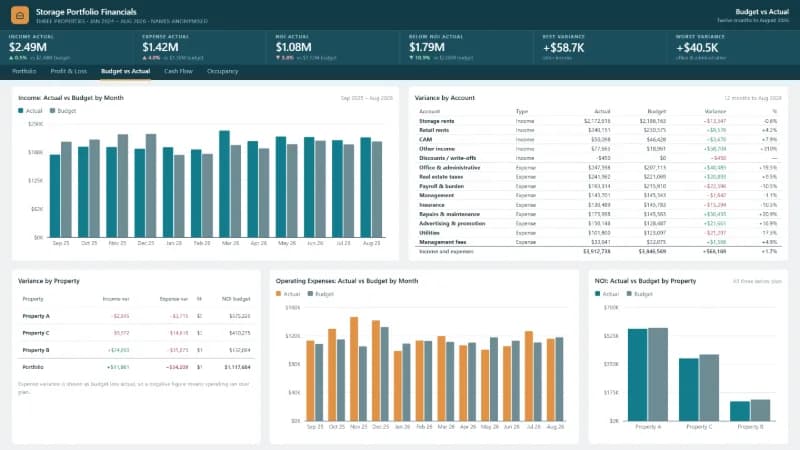
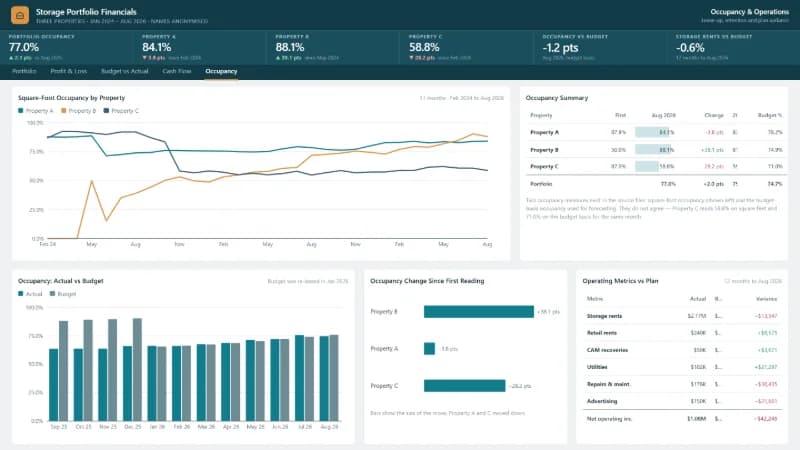
Storage Portfolio Financials
THREE PROPERTIES · NAMES ANONYMISED
$5.79M
TOTAL INCOME
$1.02M
CASH ON HAND
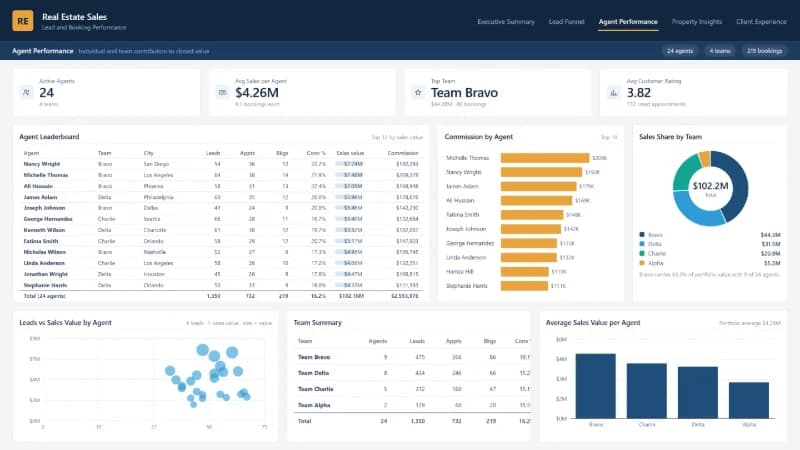
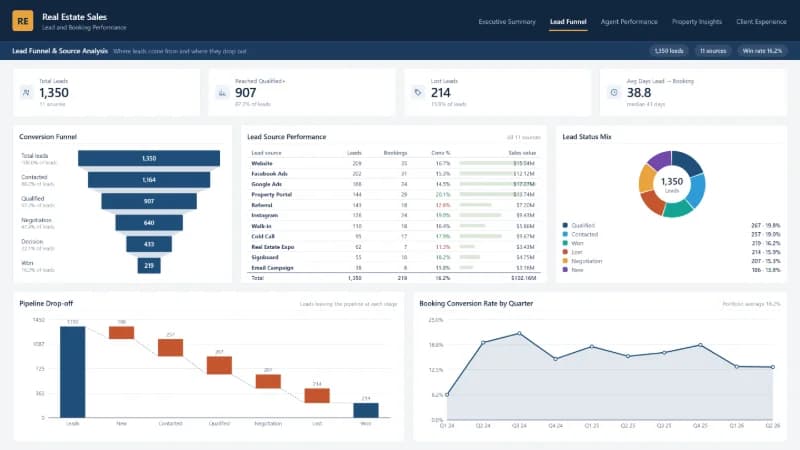
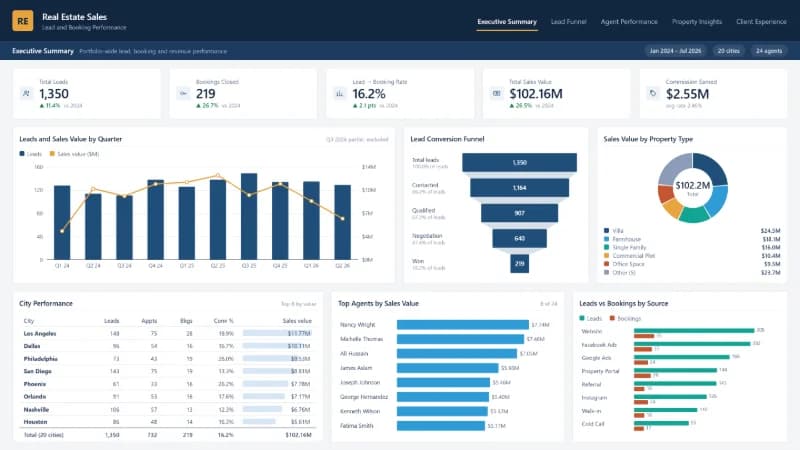
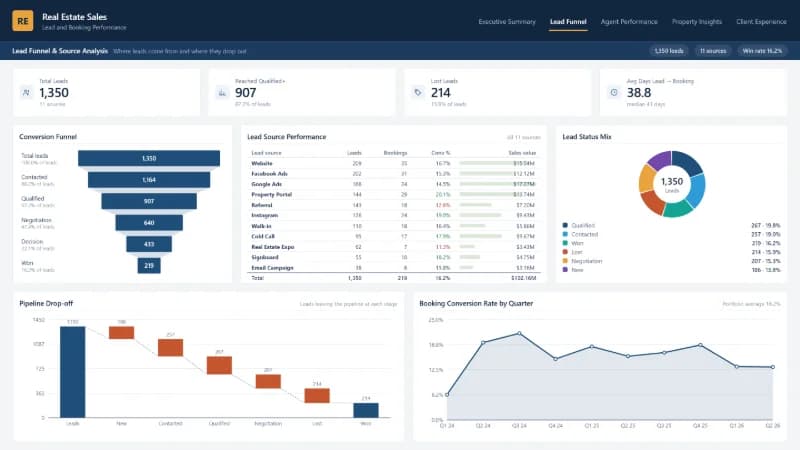
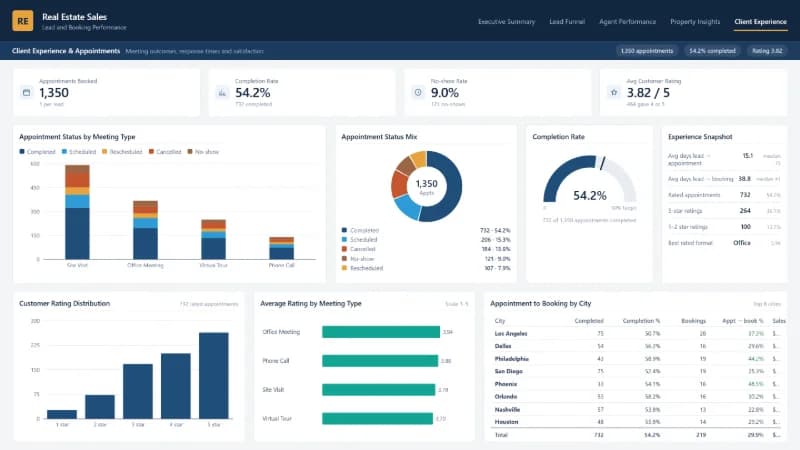
Real Estate Sales
LEAD AND BOOKING PERFORMANCE
1,350
TOTAL LEADS
$102.16M
TOTAL SALES VALUE
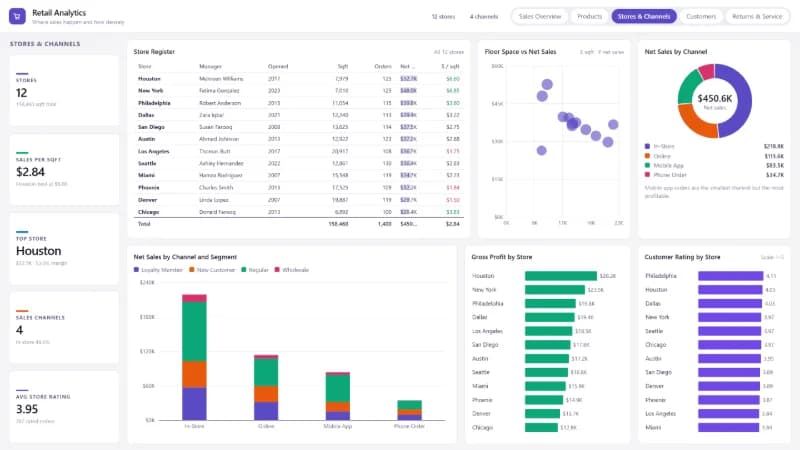
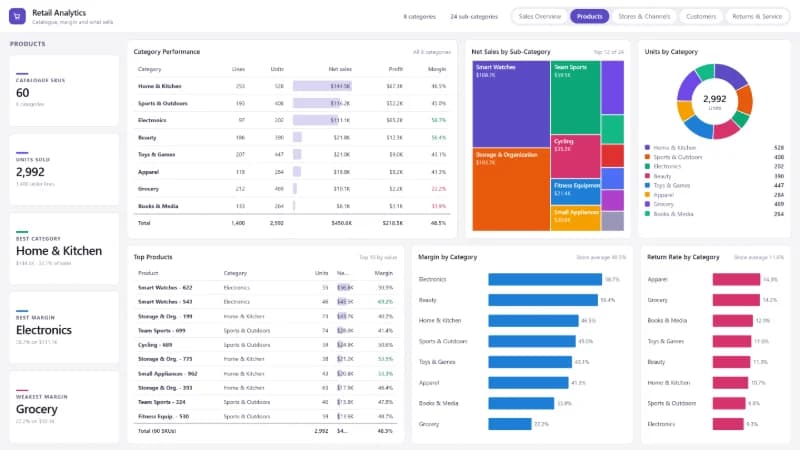
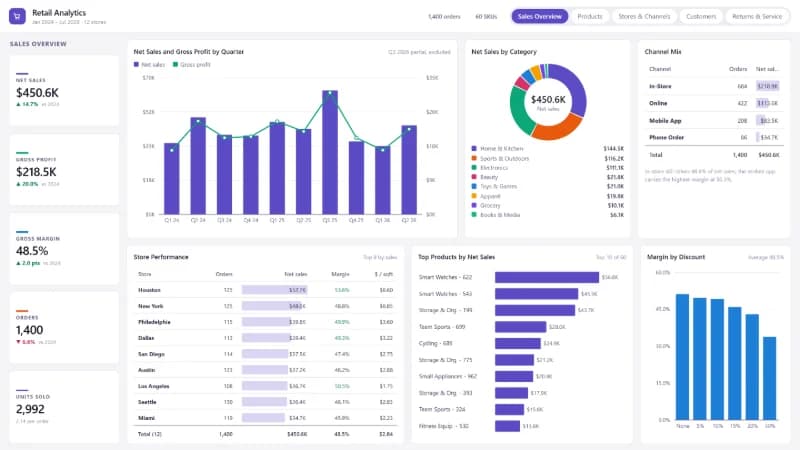
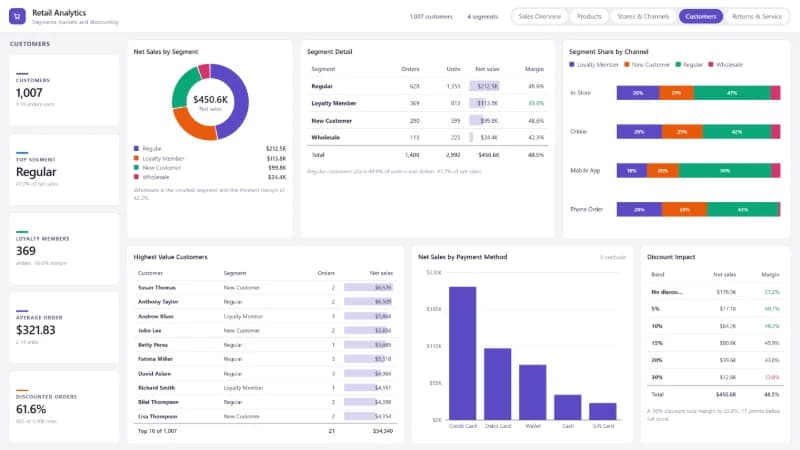
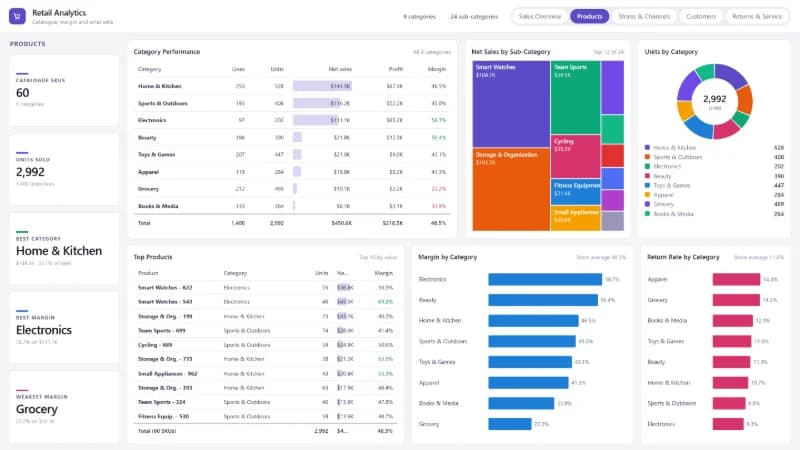
Retail Analytics
12 STORES · 60 SKUS
$450.6K
NET SALES
48.5%
GROSS MARGIN
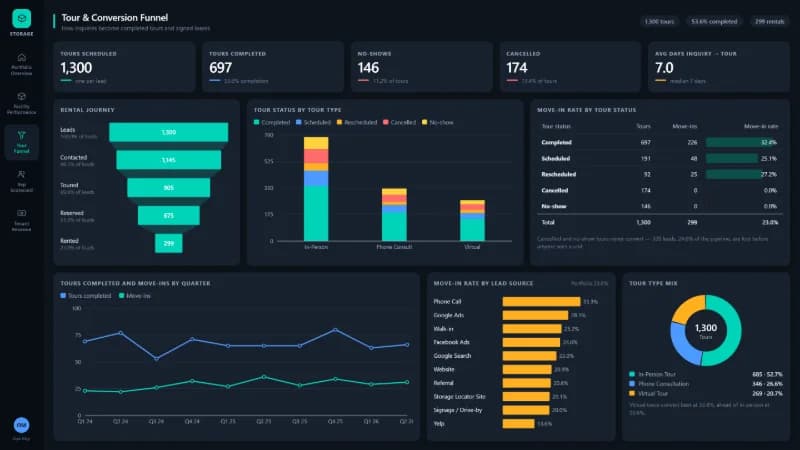
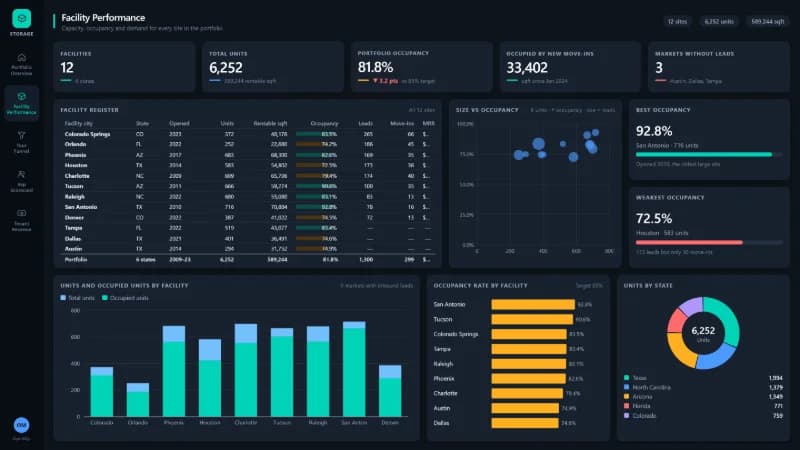
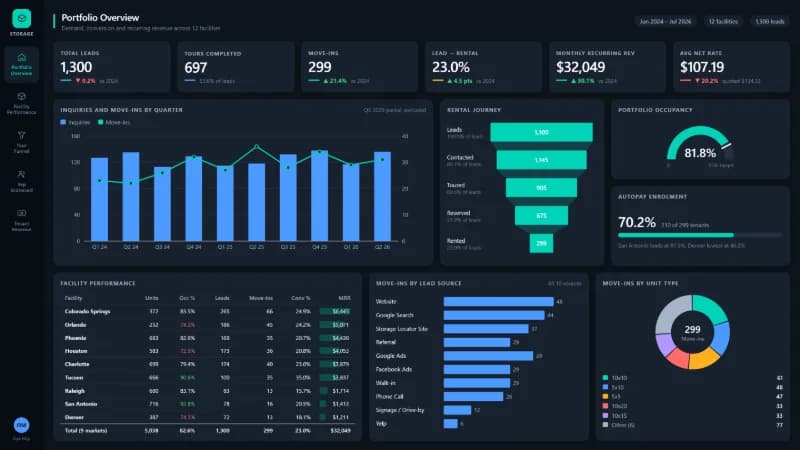
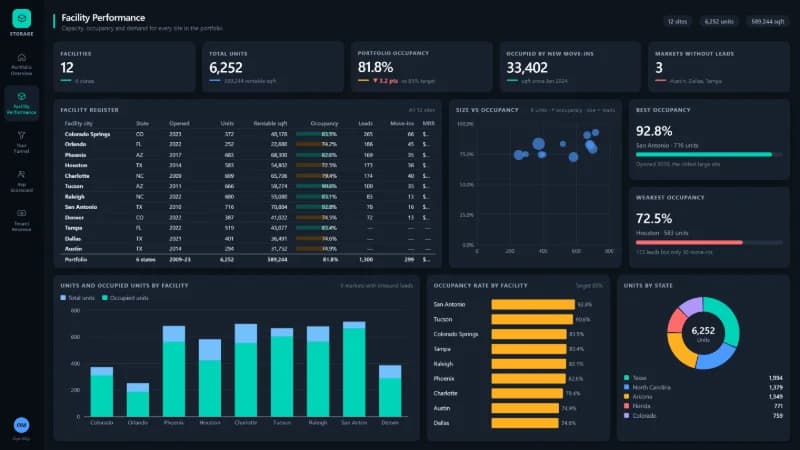
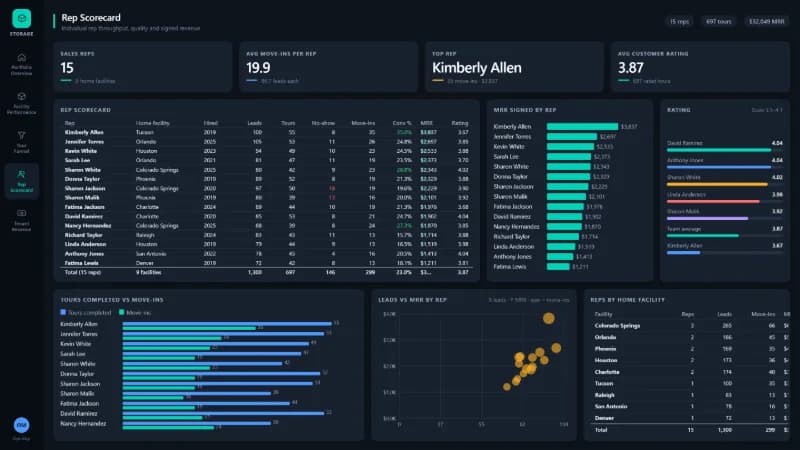
Self Storage Sales
12 FACILITIES · 6 STATES
1,300
TOTAL LEADS
23.0%
LEAD → RENTAL
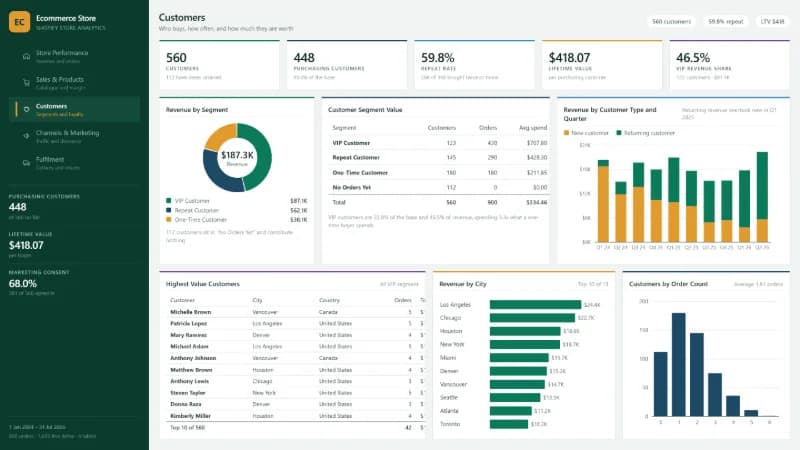
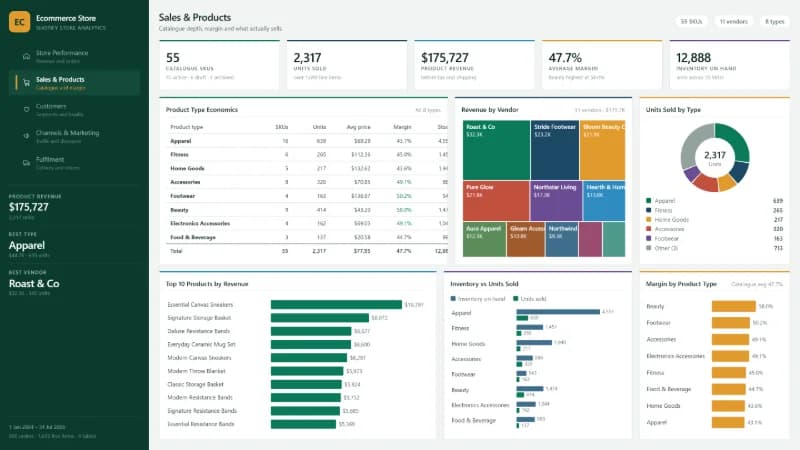
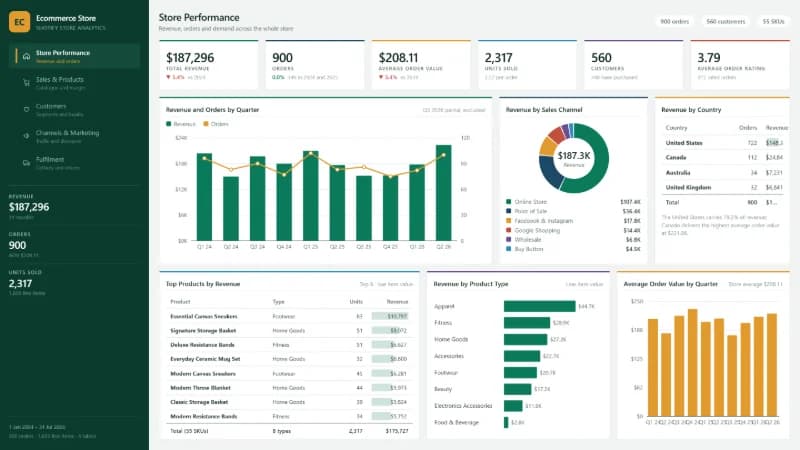
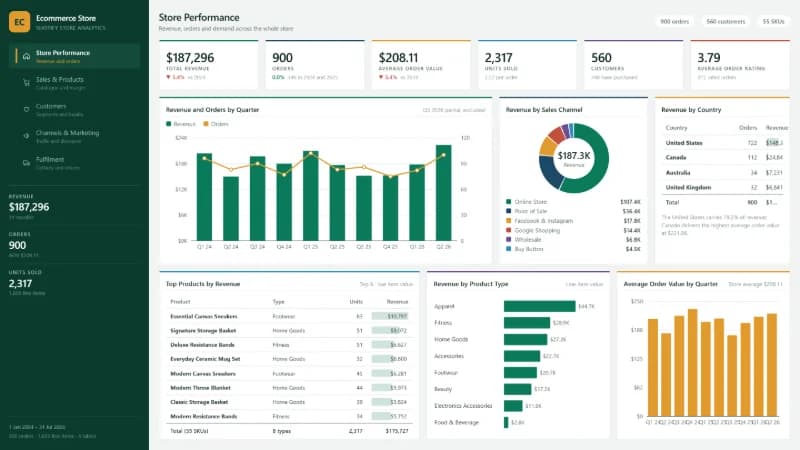
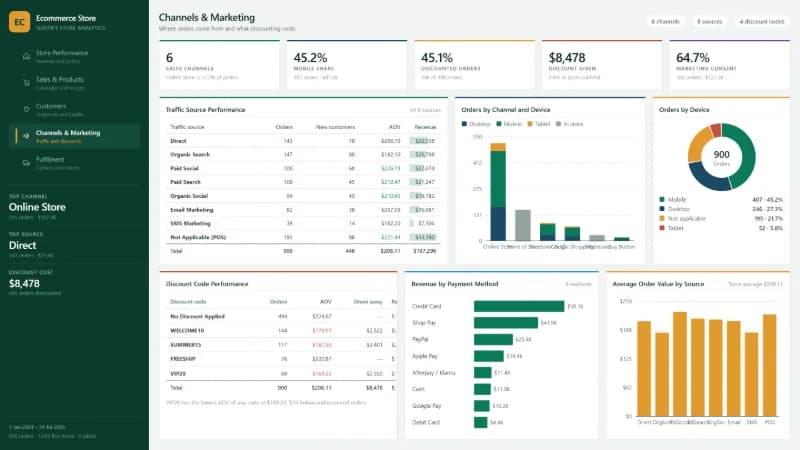
Ecommerce Store
SHOPIFY STORE ANALYTICS
$187,296
TOTAL REVENUE
560
CUSTOMERS
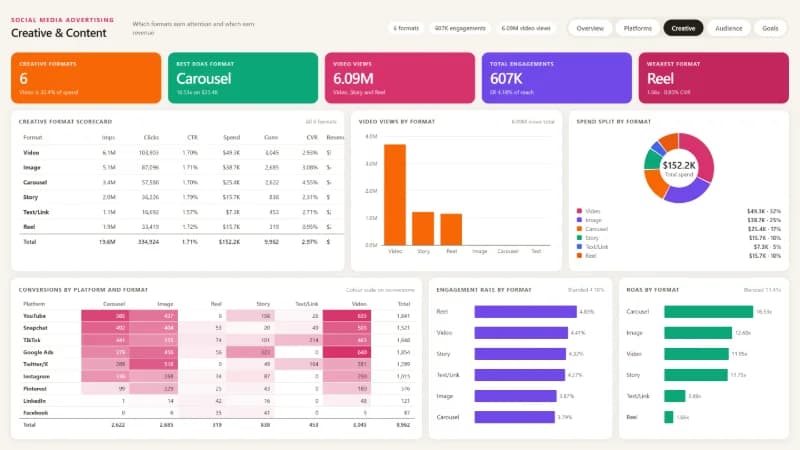
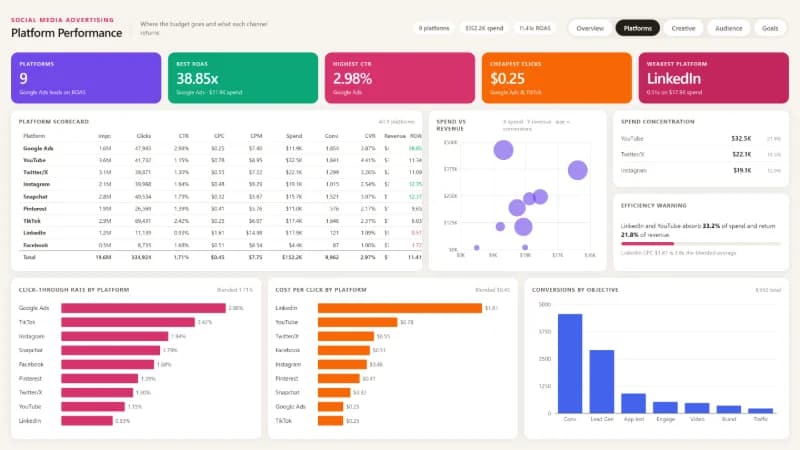
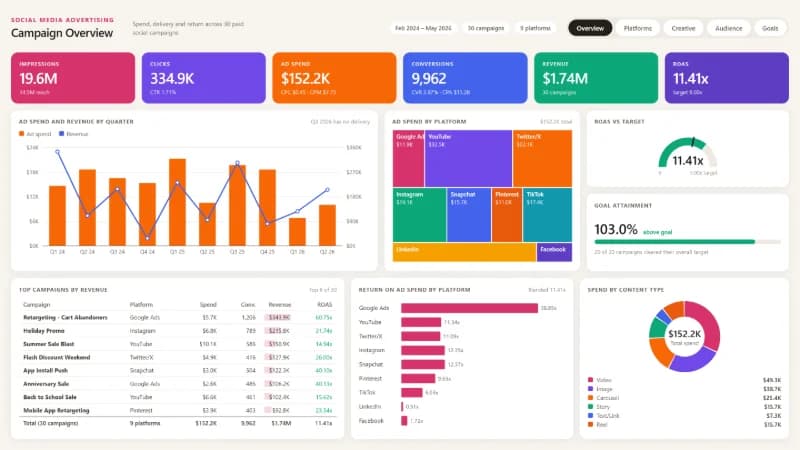
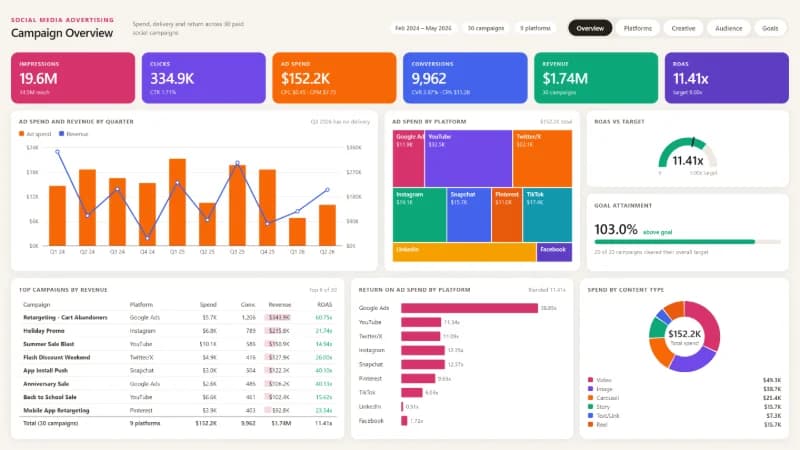
Social Media Advertising
30 PAID CAMPAIGNS · 9 PLATFORMS
$152.2K
AD SPEND
11.41x
ROAS
WHAT EVERY REPORT INCLUDES
The same six things, whatever the industry
Five pages, one question each
No page exists to hold leftover charts. Each one answers a question the leadership team asks every week, and says so at the top.
A KPI header that agrees with the detail
The four headline figures come from the same model as every chart underneath them, so a drill-down never contradicts the summary.
Drill-downs for the people who need them
An executive gets one number; a manager gets the site, rep, product or campaign behind it, without a second report being built.
A refresh you do not have to remember
Reports connect to the source systems and refresh on a schedule, replacing the export-and-paste cycle that produces last month's numbers.
Definitions written down
What counts as a lead, a win, an active tenant or a conversion is documented, so two teams reading the same report reach the same answer.
Handover, not dependency
The model and measures are documented so your own team can extend the report. Ongoing support is there if you would rather we did.
BY INDUSTRY
Reports by industry
- Construction ProjectsCONSTRUCTIONContractors and construction groups running multiple bids and awarded projects at once, where estimating, delivery, cost and safety data currently live in separate systems.
- Solar InstallationsENERGYResidential and commercial solar installers with a regional sales team, where lead, quoting and installation data sit in separate systems.
- Lending PortfolioFINANCEBanks, credit unions and specialist lenders that need origination, credit risk and servicing in one view rather than three monthly packs.
- Storage Portfolio FinancialsPROPERTY FINANCEProperty owners, asset managers and family offices running a small portfolio who need operating performance and accounting results side by side.
- Real Estate SalesREAL ESTATEEstate agencies and developer sales teams working several cities or projects, where lead source, agent performance and closed value are not currently in one report.
- Retail AnalyticsRETAILMulti-site retailers selling across more than one channel, who need margin, not just revenue, by product, store, channel and segment.
- Self Storage SalesSELF STORAGESelf-storage operators with several facilities, where occupancy is reported monthly but the tour funnel that drives it is not reported at all.
- Ecommerce StoreECOMMERCEShopify and other DTC stores past the point where built-in analytics answer the question, especially where cost, discount and fulfilment data matter.
- Social Media AdvertisingMARKETINGIn-house marketing teams and agencies running paid social across several platforms who need one comparable view of spend and return.
Want a report like these for your business?
Tell us the decision you need to get right. We'll show you what the data can answer in a free 30-minute call.