
HOME / WORK / STORAGE PORTFOLIO FINANCIALS
CASE STUDY · PROPERTY FINANCE
Storage Portfolio Financials
THREE PROPERTIES · NAMES ANONYMISED
Combines profit and loss, budget variance, cash flow and occupancy for a three-property self-storage portfolio, so owners see operating performance and accounting results side by side.
TOTAL INCOME
$5.79M
up 23.8%, 2025 vs 2024
NET OPERATING INCOME
$2.36M
40.8% margin
CASH ON HAND
$1.02M
down $294K since Jan 2026
OCCUPANCY
77.0%
Aug 2026, by sq ft
WALK THE REPORT
Five pages, one question each
Each page answers one question the leadership team asks every week. Pick a page to see it full size.
THE QUESTION
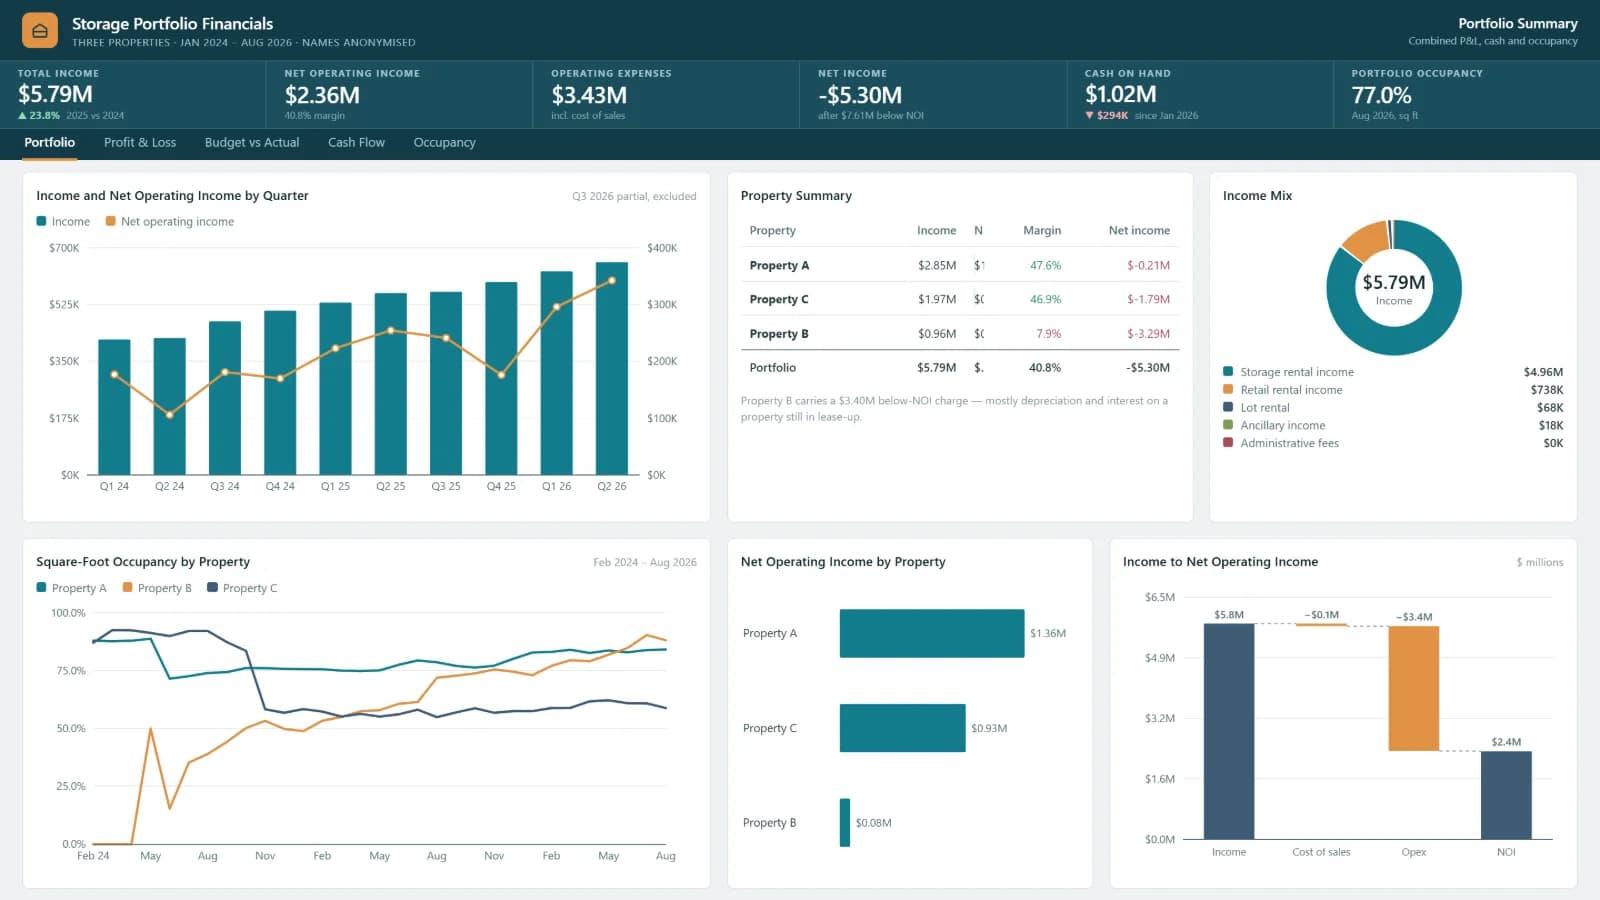
How is the portfolio performing as a whole, operationally and on paper?
$5.79M
total income
$2.36M
net operating income at a 40.8% margin
-$5.30M
net income after $7.61M below NOI
CONTEXT
Why a property owner needs this report
Owners of a small property portfolio usually get two separate stories. The accountant produces a statutory P&L with depreciation and interest in it; the operator produces an occupancy and income summary. Both are correct, and neither answers whether the portfolio is working.
The gap matters most when a portfolio is still leasing up. Net operating income can be growing strongly while the bottom line is deep in the red because of depreciation and interest, and cash can be falling while income rises because capital is going into assets not yet in service.
How the report is built
One report puts the operating view and the accounting view on the same page: a portfolio summary, a P&L by property, budget variance for the trailing twelve months, cash flow, and occupancy against the lease-up plan.
Every measure is available at portfolio and property level, so an owner can see the combined position and then explain it — which property carries the margin, where the budget slipped, and what is holding cash.
WHAT IT BRINGS TOGETHER
- General ledger and trial balance
- Property-level income and expenses
- Annual budget by line item
- Cash flow, loan draws and refinancing
- Occupancy and rentable square footage
- Lease-up plan by property
WHO IT SUITS
Property owners, asset managers and family offices running a small portfolio who need operating performance and accounting results side by side.
PAGE BY PAGE
What each page of the storage portfolio financials report answers
PAGE 01
Portfolio Summary
Combined P&L, cash and occupancy
How is the portfolio performing as a whole, operationally and on paper?
- $5.79M total income
- $2.36M net operating income at a 40.8% margin
- -$5.30M net income after $7.61M below NOI
PAGE 02
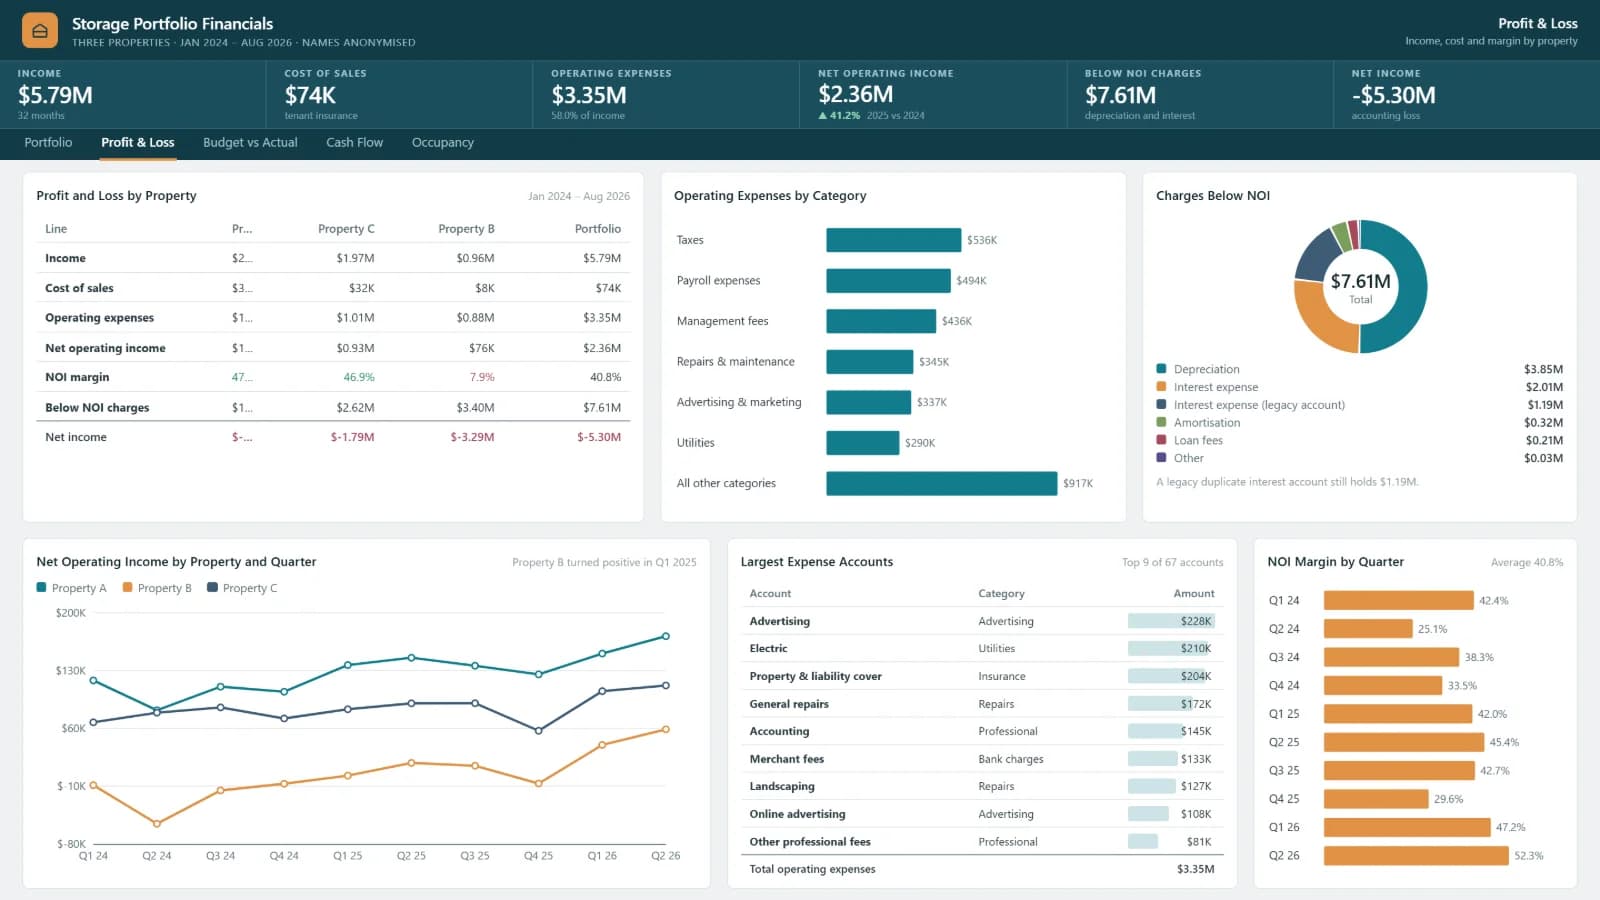
Profit & Loss
Income, cost and margin by property
Which properties earn their keep once every cost is counted?
- $3.35M operating expenses, 58.0% of income
- 41.2% NOI growth, 2025 vs 2024
- $7.61M depreciation and interest below NOI
PAGE 03
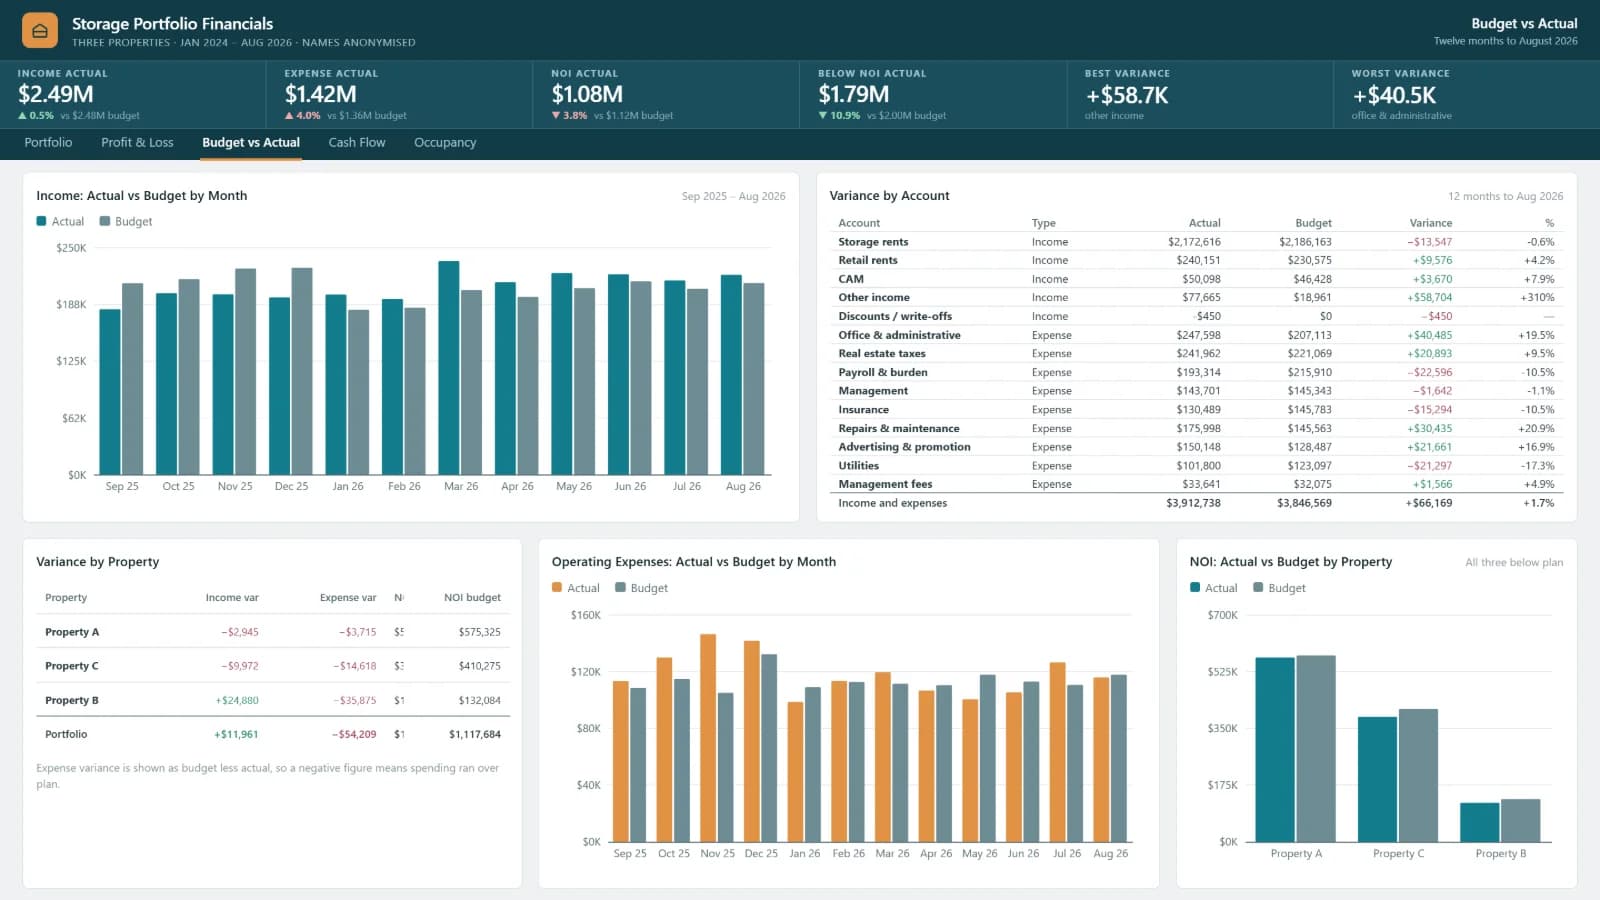
Budget vs Actual
Twelve months to August 2026
Are income and costs landing where the budget said they would?
- $2.49M income, 0.5% over budget
- $1.42M expenses, 4.0% over budget
- $1.08M NOI, 3.8% under budget
PAGE 04
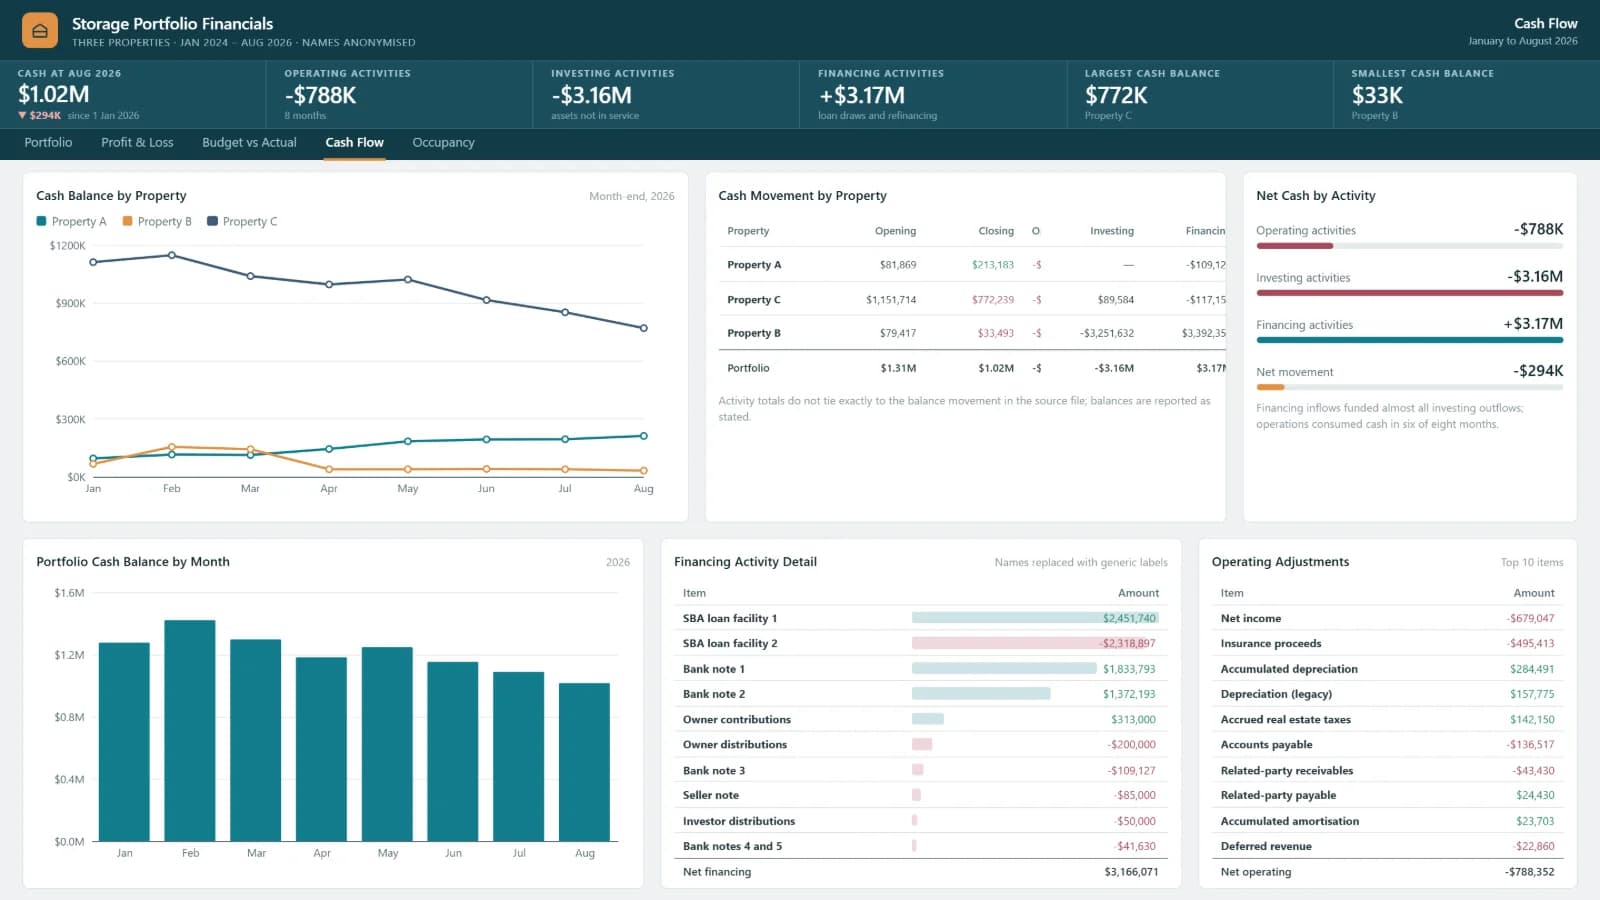
Cash Flow
January to August 2026
Where is cash coming from, and where is it going?
- $1.02M cash at August 2026
- -$3.16M invested in assets not yet in service
- +$3.17M from loan draws and refinancing
PAGE 05
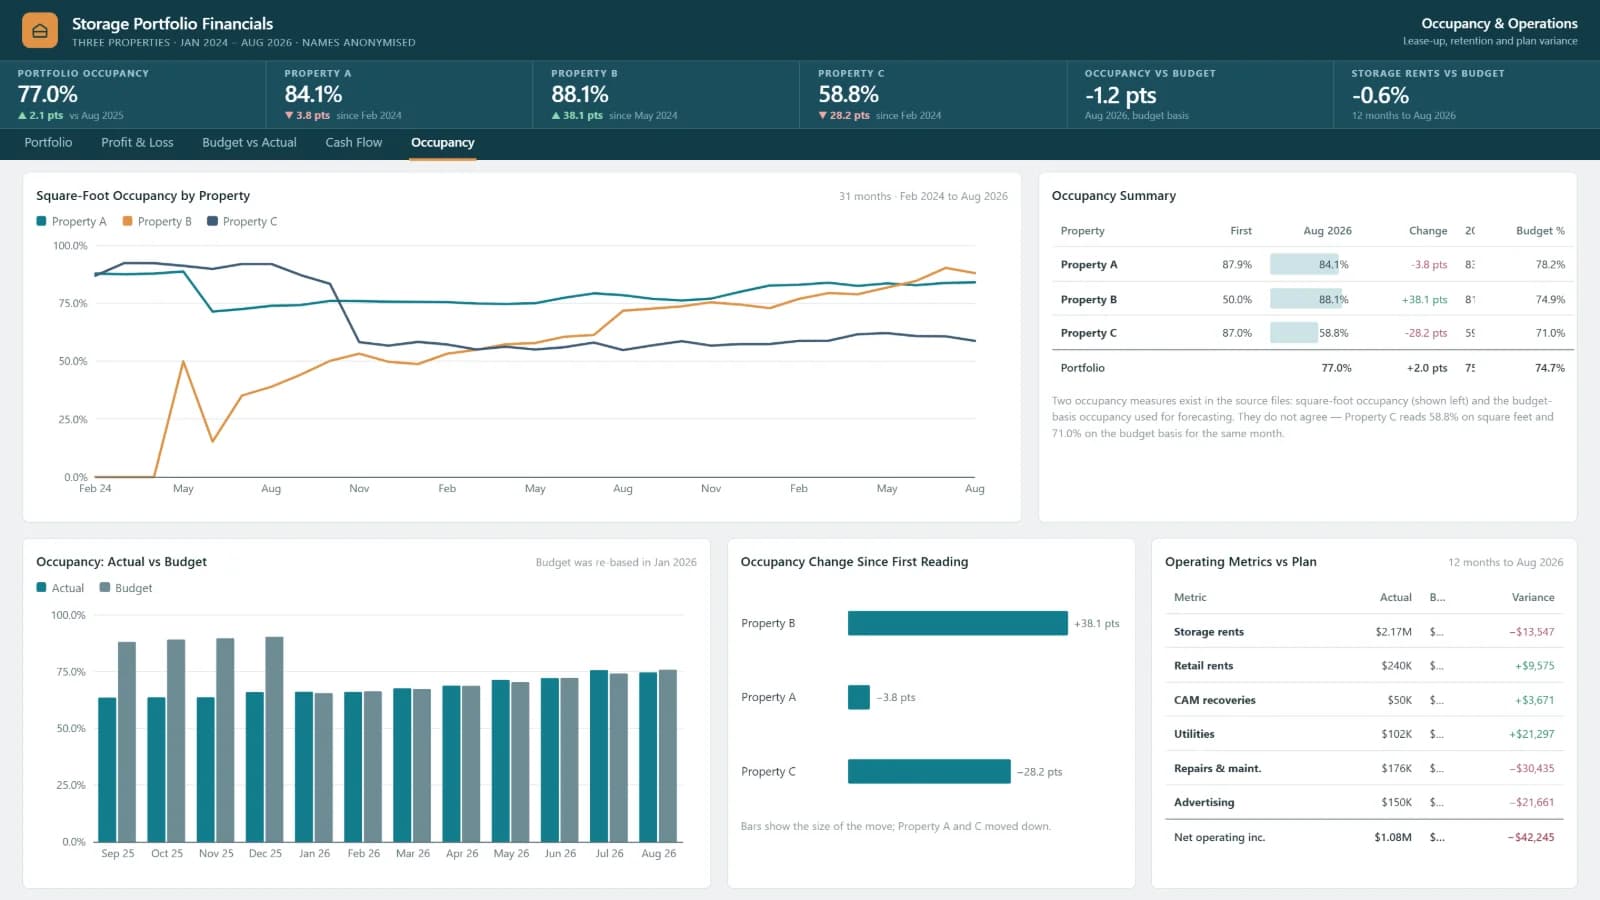
Occupancy & Operations
Lease-up, retention and plan variance
How quickly are properties filling, and how far off plan are they?
- 84.1% occupancy at Property A
- 88.1% at Property B, up 38.1 pts since May 2024
- 58.8% at Property C
What the report surfaced
Figures the property finance report puts in front of the leadership team every week.
- $5.79M of total income, up 23.8% year on year, produced $2.36M of net operating income at a 40.8% margin.
- Below NOI, $7.61M of depreciation and interest turns that into a -$5.30M net income — the distinction most operating reports hide.
- Against budget, income landed 0.5% ahead at $2.49M while expenses ran 4.0% over, leaving NOI 3.8% short.
- Cash stands at $1.02M, down $294K since January, with $3.16M invested in assets not yet in service and $3.17M drawn from loans and refinancing.
- Occupancy is 77.0% portfolio-wide: 84.1% at Property A, 88.1% at Property B (up 38.1 points since May 2024) and 58.8% at Property C.
Want a report like this for your business?
Tell us the decision you need to get right. We'll show you what the data can answer in a free 30-minute call.