
HOME / WORK / ECOMMERCE STORE
CASE STUDY · ECOMMERCE
Ecommerce Store
SHOPIFY STORE ANALYTICS
Turns a Shopify store's orders, products, customers, marketing and fulfilment data into one report, from revenue by channel to orders still sitting unshipped.
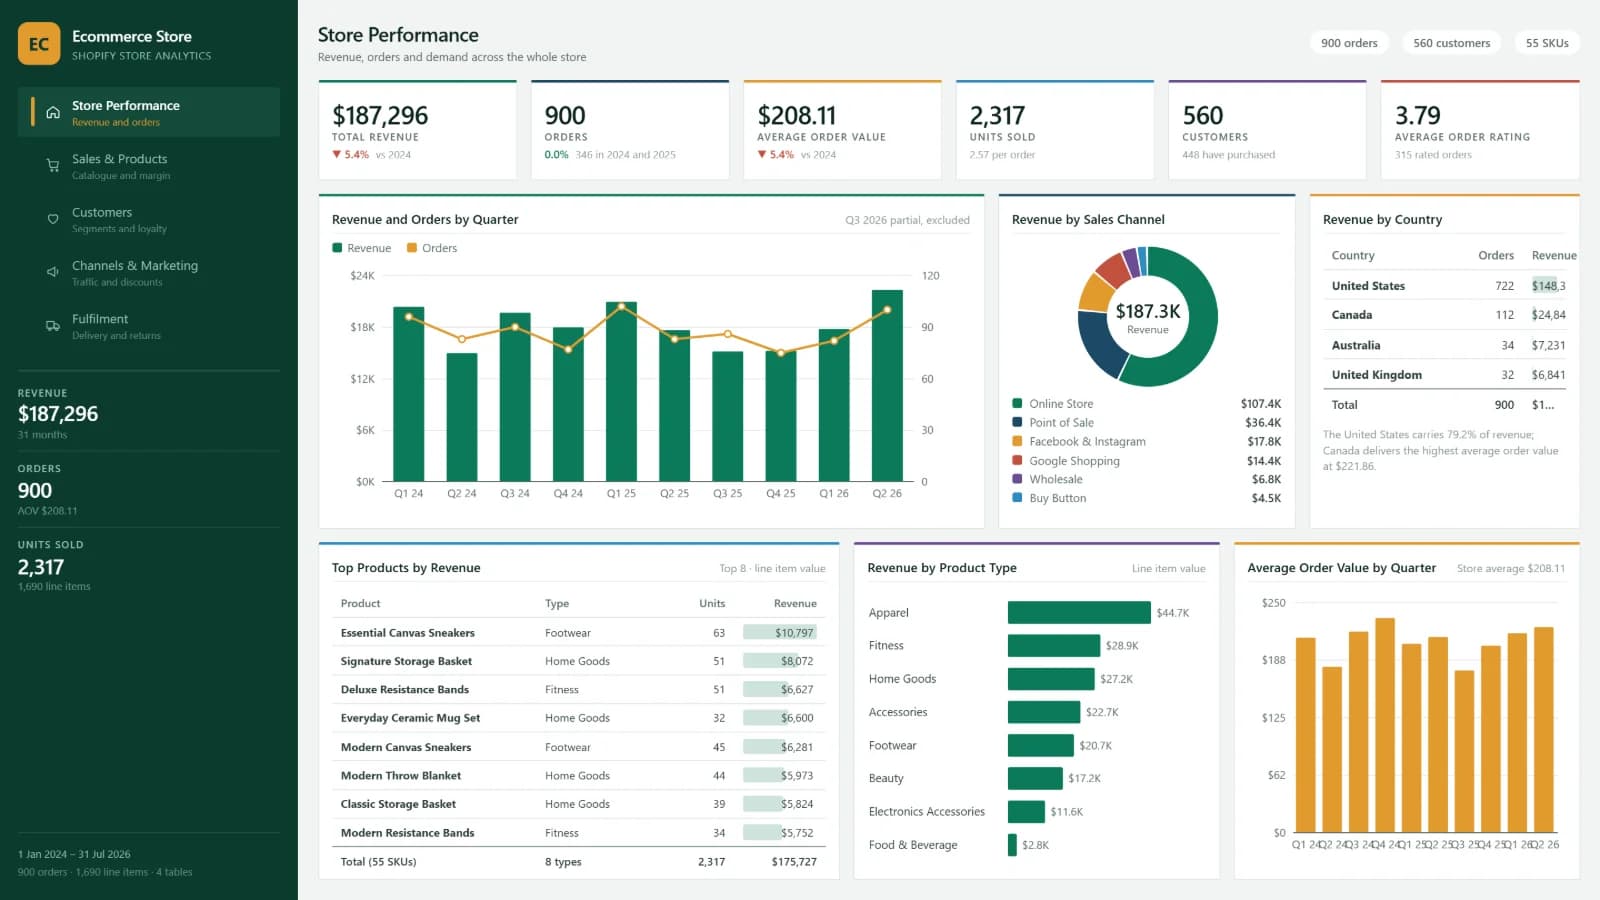
TOTAL REVENUE
$187,296
31 months
ORDERS
900
average order $208.11
CUSTOMERS
560
448 have purchased
ORDER RATING
3.79
315 rated orders
WALK THE REPORT
Five pages, one question each
Each page answers one question the leadership team asks every week. Pick a page to see it full size.
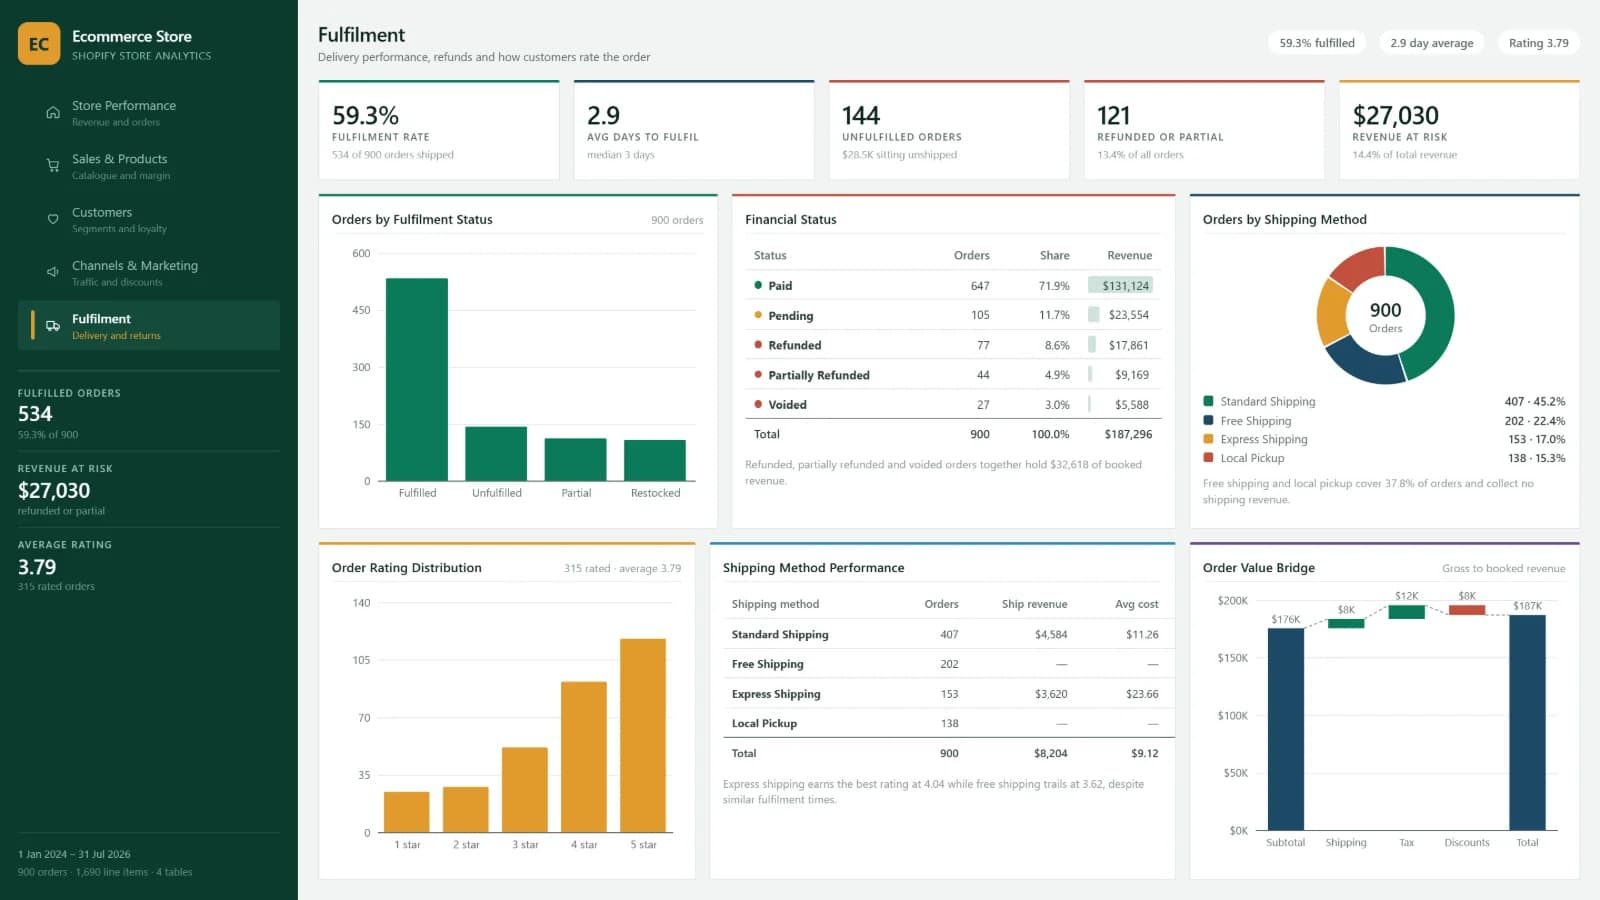
THE QUESTION
How is the store trading, and where does the revenue come from?
$107.4K
through the online store
79.2%
of revenue from the United States
$221.86
average order in Canada, the highest
Want a report like this for your business?
Tell us the decision you need to get right. We'll show you what the data can answer in a free 30-minute call.