
HOME / WORK / SOCIAL MEDIA ADVERTISING
CASE STUDY · MARKETING
Social Media Advertising
30 PAID CAMPAIGNS · 9 PLATFORMS
Measures spend, delivery and return across 30 paid social campaigns on 9 platforms, down to which creative formats, audiences and markets pay back.
AD SPEND
$152.2K
CPC $0.45 · CPM $7.75
REVENUE
$1.74M
across 30 campaigns
ROAS
11.41x
against a 9.00x target
GOAL ATTAINMENT
103.0%
20 of 30 campaigns above goal
WALK THE REPORT
Five pages, one question each
Each page answers one question the leadership team asks every week. Pick a page to see it full size.
THE QUESTION
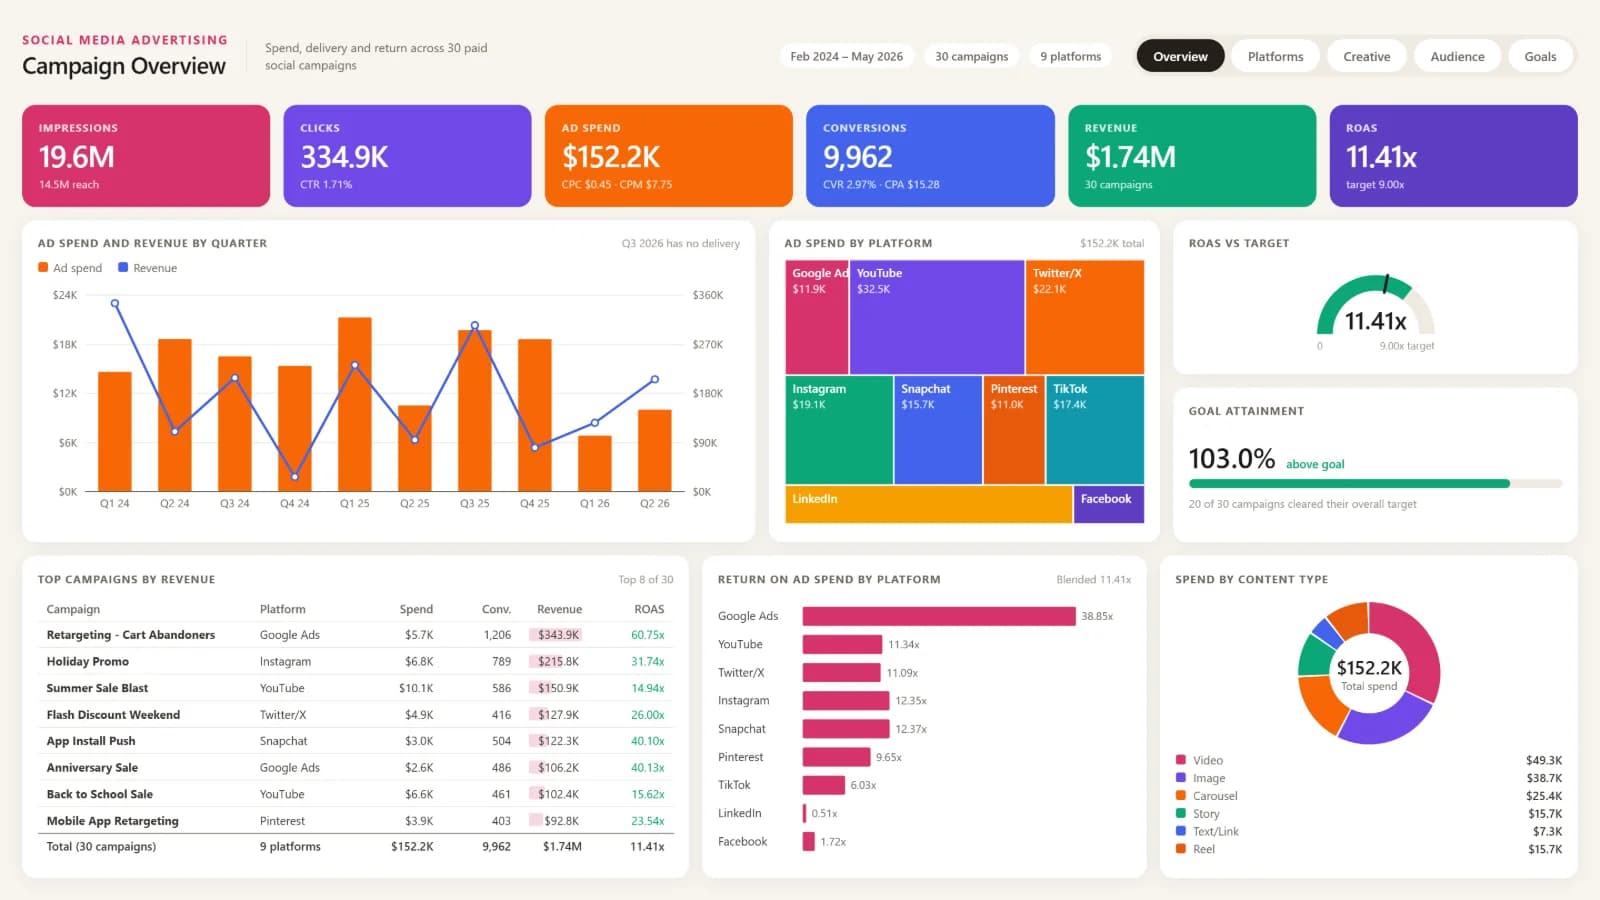
What did the spend buy, and did it pay back?
19.6M
impressions, 14.5M reach
9,962
conversions at a $15.28 CPA
$343.9K
from cart-abandoner retargeting, the top campaign
CONTEXT
Why an advertiser needs this report
Every ad platform reports its own performance, in its own definitions, and always favourably. Comparing them means exporting nine sets of numbers into a spreadsheet, aligning attribution windows, and doing it again next week.
What gets lost is the comparison that decides budget: return per dollar across platforms, formats, audiences and markets on one definition, measured against the goal that was set before the campaign started.
How the report is built
Five pages run from a campaign overview through platform performance, creative and content, audience insight, and finally goals against actuals — the page that turns a performance report into an accountability one.
Spend, delivery and revenue are normalised into one set of definitions across all nine platforms, so ROAS, CPA and CTR mean the same thing everywhere and can be compared without a spreadsheet in between.
WHAT IT BRINGS TOGETHER
- Campaign spend and delivery by platform
- Impressions, reach and engagement
- Conversions and revenue
- Creative format and asset metadata
- Audience, age band and market
- Planned budget and goals
WHO IT SUITS
In-house marketing teams and agencies running paid social across several platforms who need one comparable view of spend and return.
PAGE BY PAGE
What each page of the social media advertising report answers
PAGE 01
Campaign Overview
Spend, delivery and return across 30 campaigns
What did the spend buy, and did it pay back?
- 19.6M impressions, 14.5M reach
- 9,962 conversions at a $15.28 CPA
- $343.9K from cart-abandoner retargeting, the top campaign
PAGE 02
Platform Performance
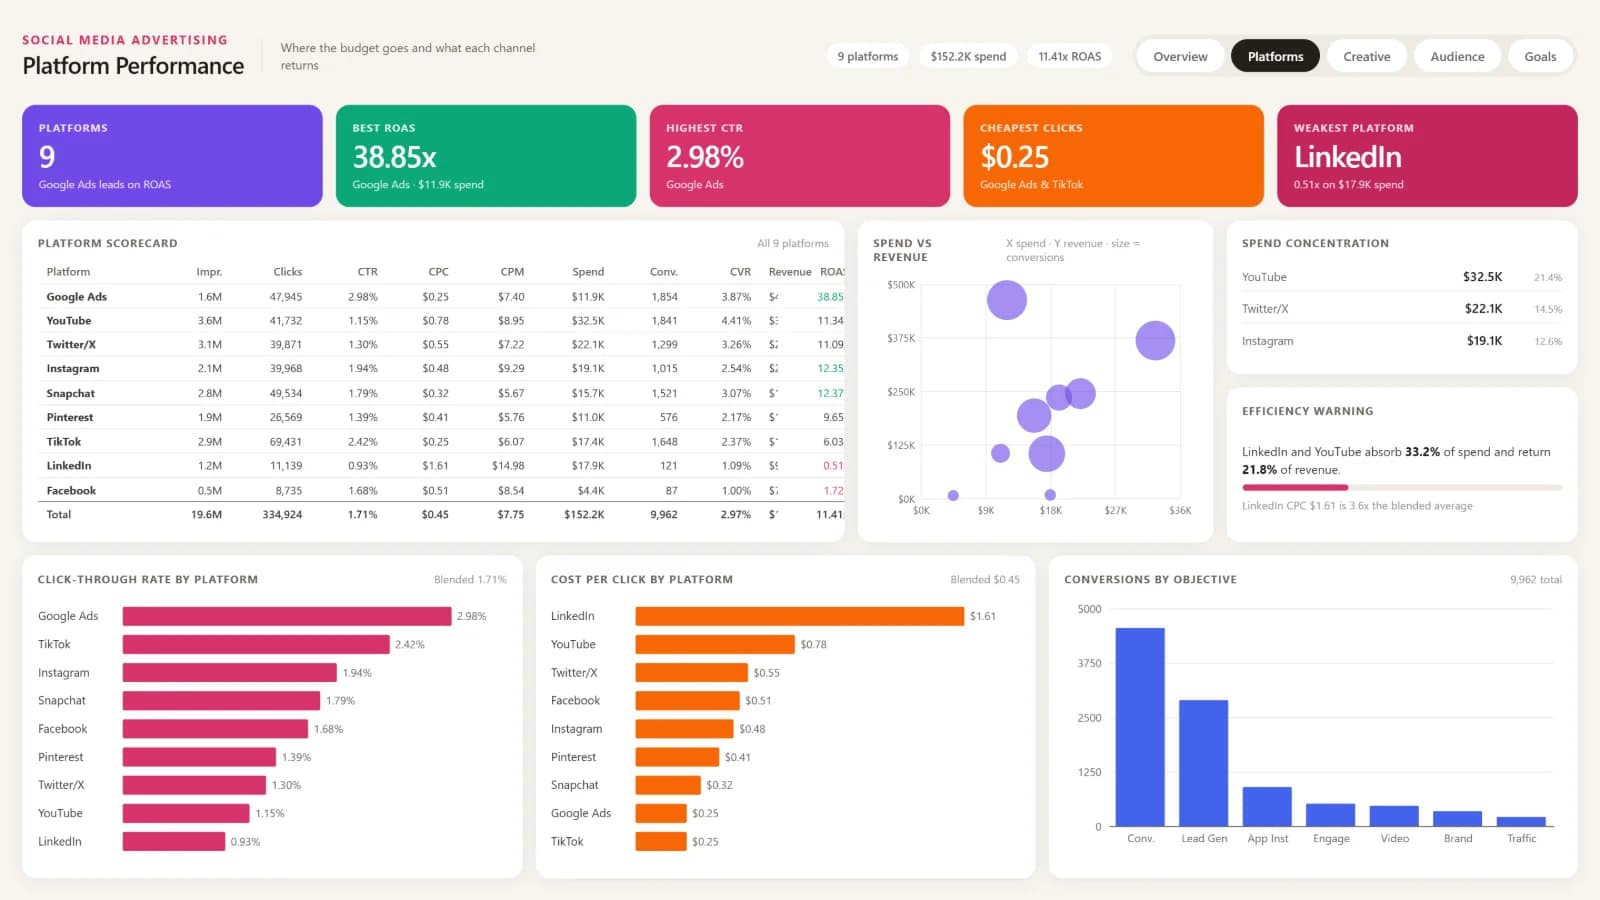
Where the budget goes and what each channel returns
Which platforms return the most for each dollar?
- 38.85x ROAS on Google Ads, the best
- 2.98% highest click-through rate
- 0.51x ROAS on LinkedIn, the weakest
PAGE 03
Creative & Content
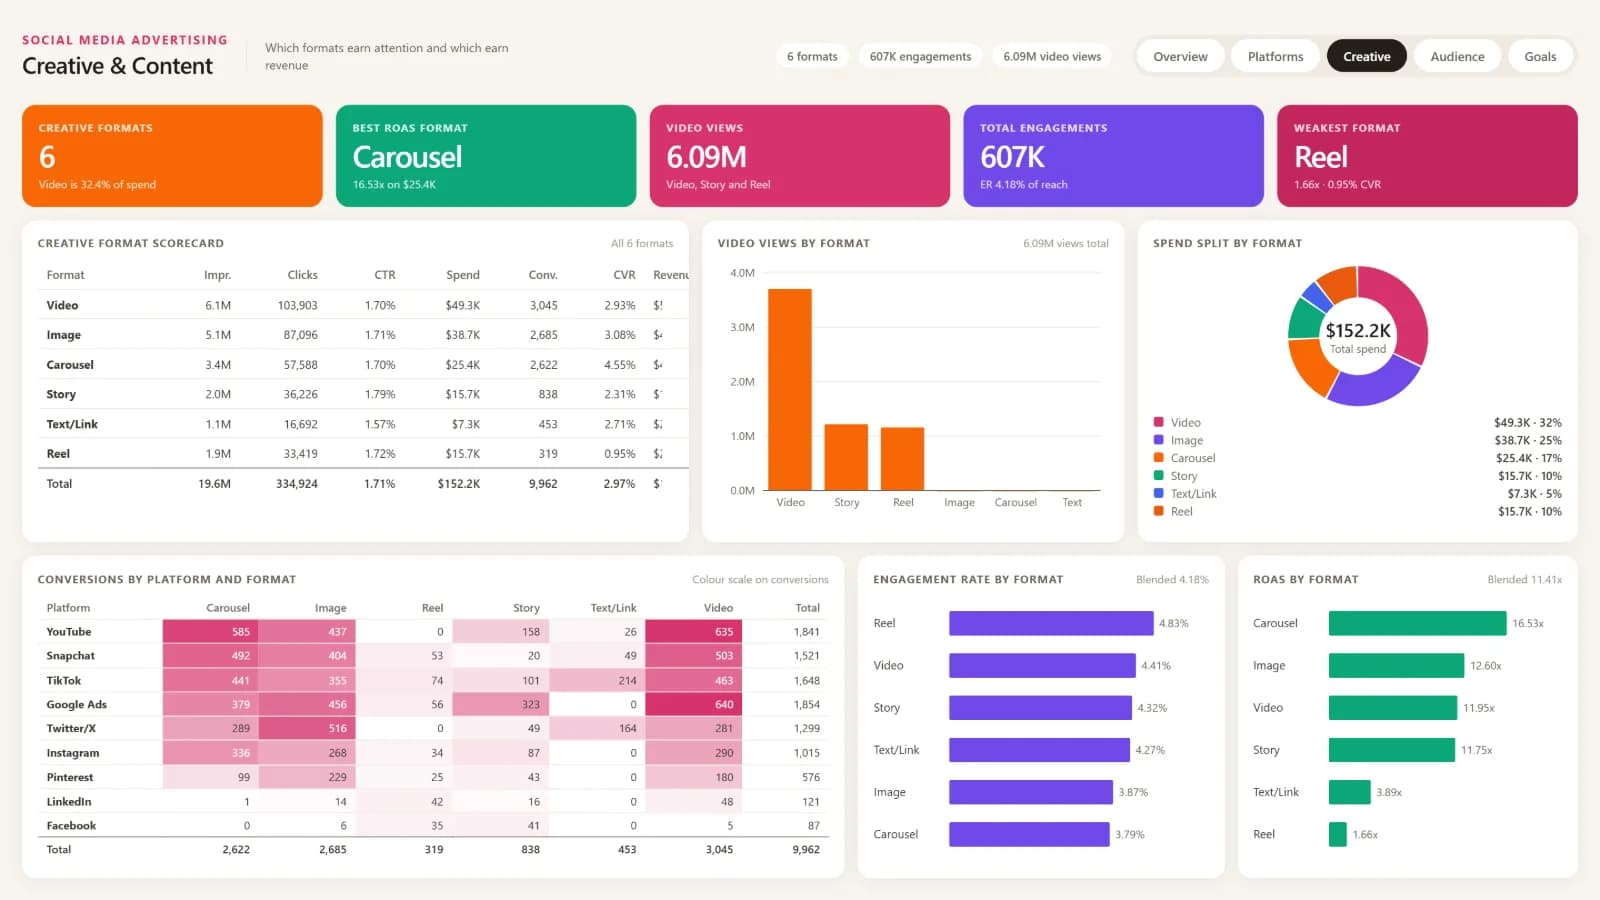
Which formats earn attention and which earn revenue
Which formats earn attention, and which earn revenue?
- 16.53x ROAS on carousels, the best format
- 6.09M video views
- 607K total engagements
PAGE 04
Audience Insights
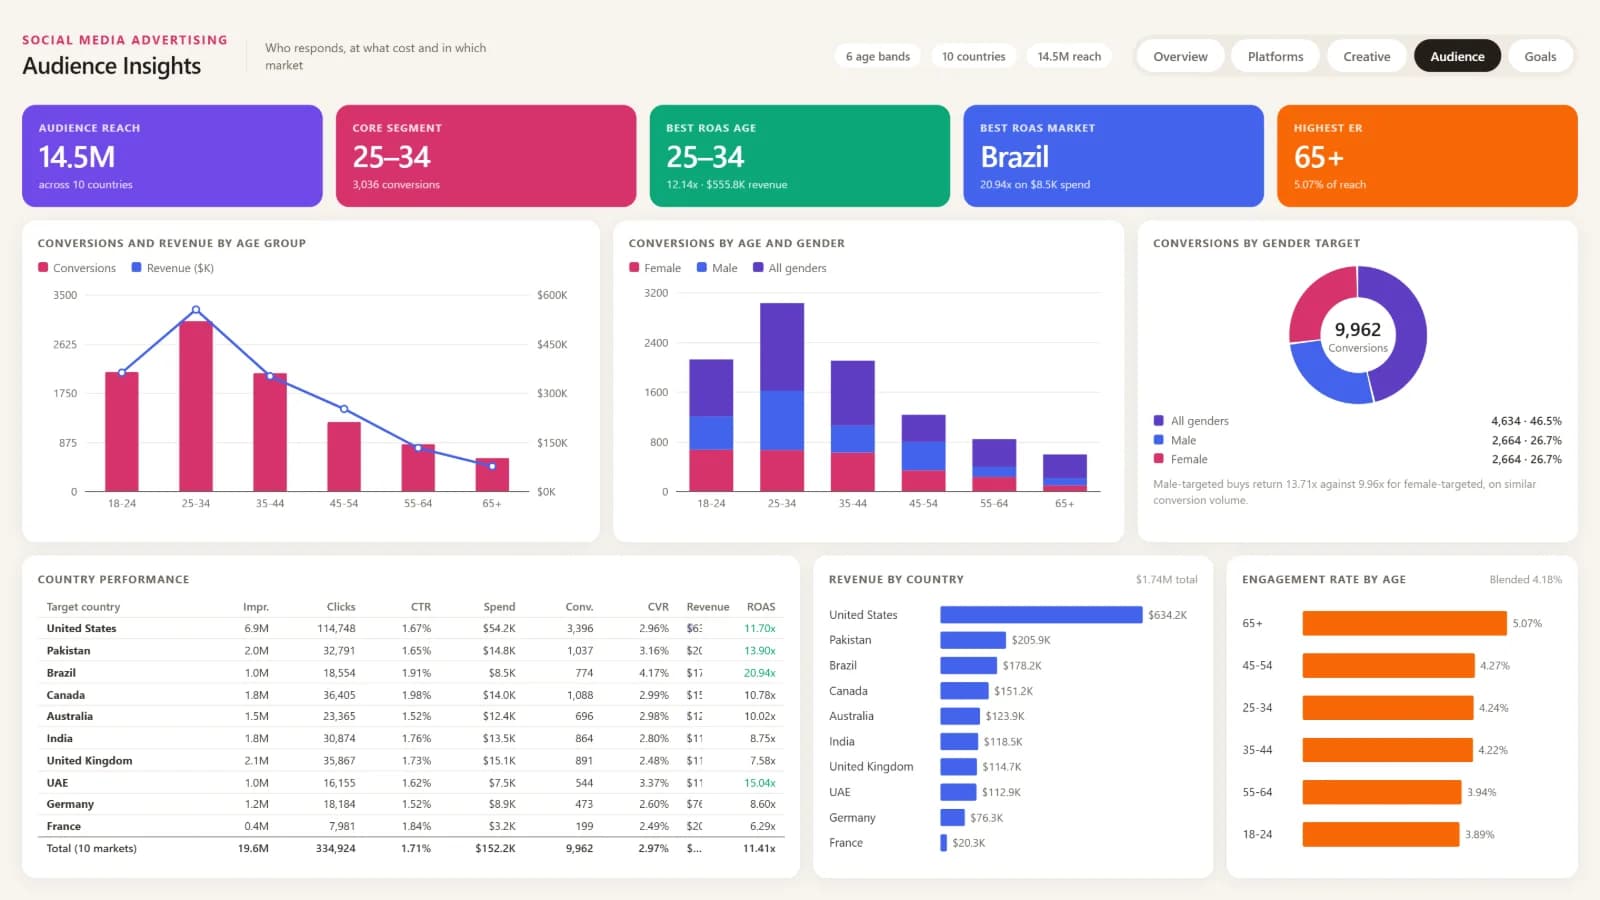
Who responds, at what cost and in which market
Who responds, at what cost, and in which markets?
- 14.5M reach across 10 countries
- 25–34 the core converting segment
- 20.94x ROAS in Brazil, the best market
PAGE 05
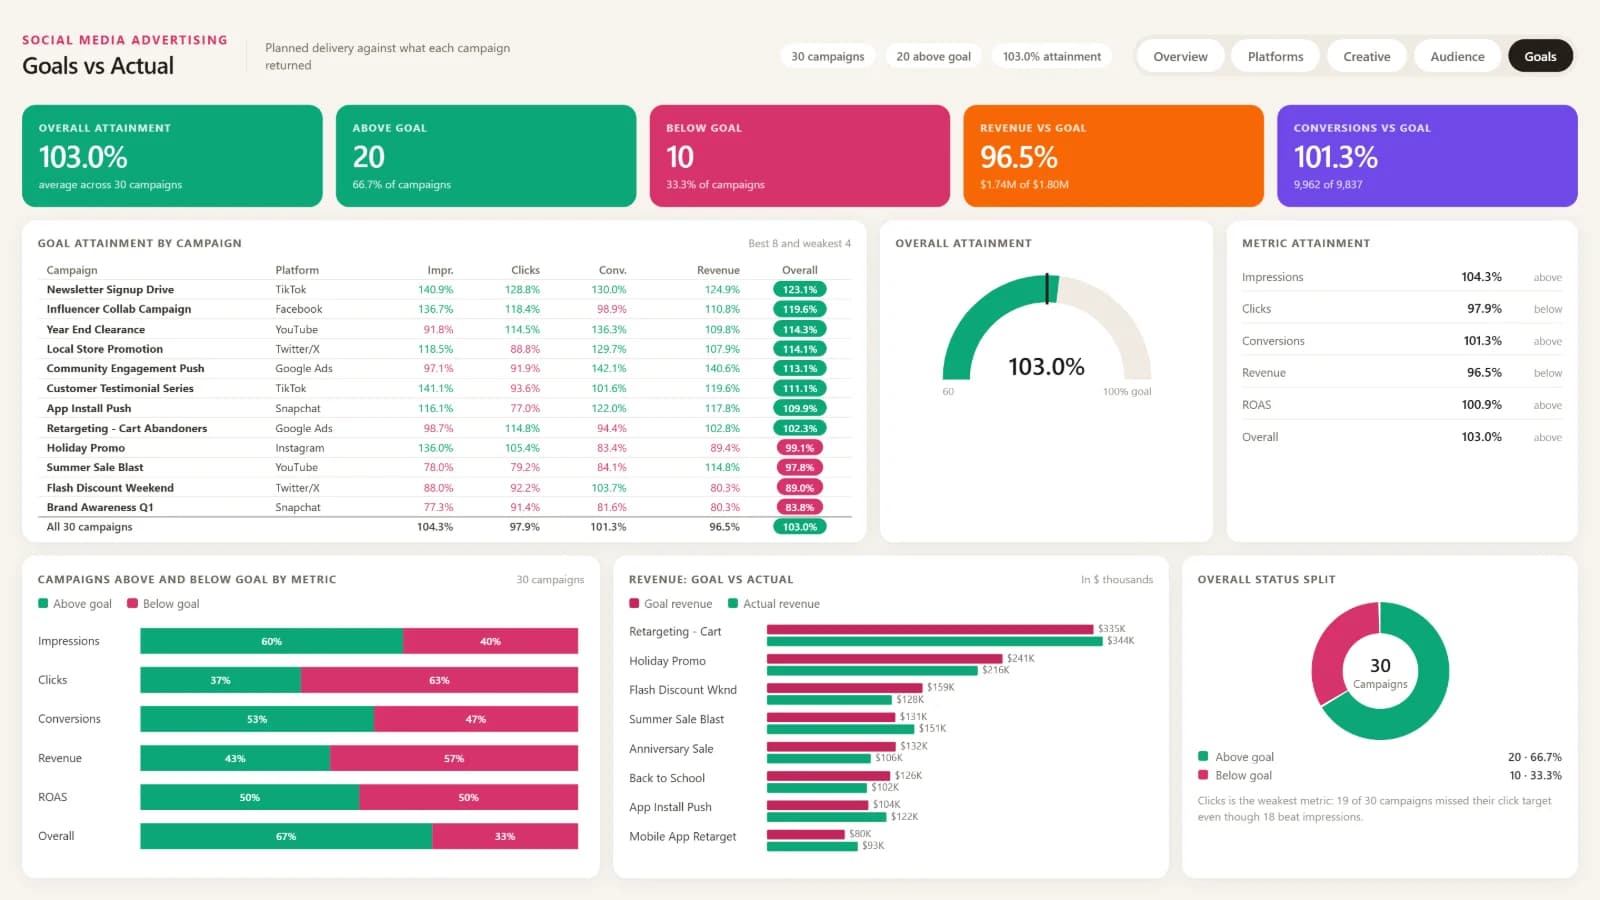
Goals vs Actual
Planned delivery against what each campaign returned
Did each campaign deliver what it was planned to?
- 103.0% overall goal attainment
- 20 campaigns above goal, 10 below
- 96.5% of revenue goal ($1.74M of $1.80M)
What the report surfaced
Figures the marketing report puts in front of the leadership team every week.
- $152.2K of spend returned $1.74M of revenue across 30 campaigns — an 11.41x ROAS against a 9.00x target.
- 19.6M impressions reached 14.5M people and produced 9,962 conversions at a $15.28 CPA, with cart-abandoner retargeting the top campaign at $343.9K.
- Platform returns range from 38.85x on Google Ads to 0.51x on LinkedIn, a 76-fold spread that platform-by-platform reporting never shows side by side.
- Carousels are the strongest format at 16.53x ROAS, against 6.09M video views and 607K total engagements.
- The 25–34 band is the core converting segment, Brazil returns best of 10 markets at 20.94x, and 20 of 30 campaigns beat their goal for 103.0% overall attainment.
Want a report like this for your business?
Tell us the decision you need to get right. We'll show you what the data can answer in a free 30-minute call.