
HOME / WORK / RETAIL ANALYTICS
CASE STUDY · RETAIL
Retail Analytics
12 STORES · 60 SKUS
Covers sales, products, stores and channels, customers and returns for a 12-store retailer, from category margin down to who serves the customer.
Retail5 report pagesJan 2024 – Jul 202612 stores
NET SALES
$450.6K
up 14.7% vs 2024
GROSS PROFIT
$218.5K
up 20.0% vs 2024
GROSS MARGIN
48.5%
up 2.0 pts vs 2024
ORDERS
1,400
2,992 units sold
WALK THE REPORT
Five pages, one question each
Each page answers one question the leadership team asks every week. Pick a page to see it full size.
RARetail AnalyticsSALES · STORES · CUSTOMERS
Jan 2024 – Jul 2026 · 1,400 orders · 12 stores · 60 SKUs
Retail Analytics · Sales OverviewPAGE 01 / 05
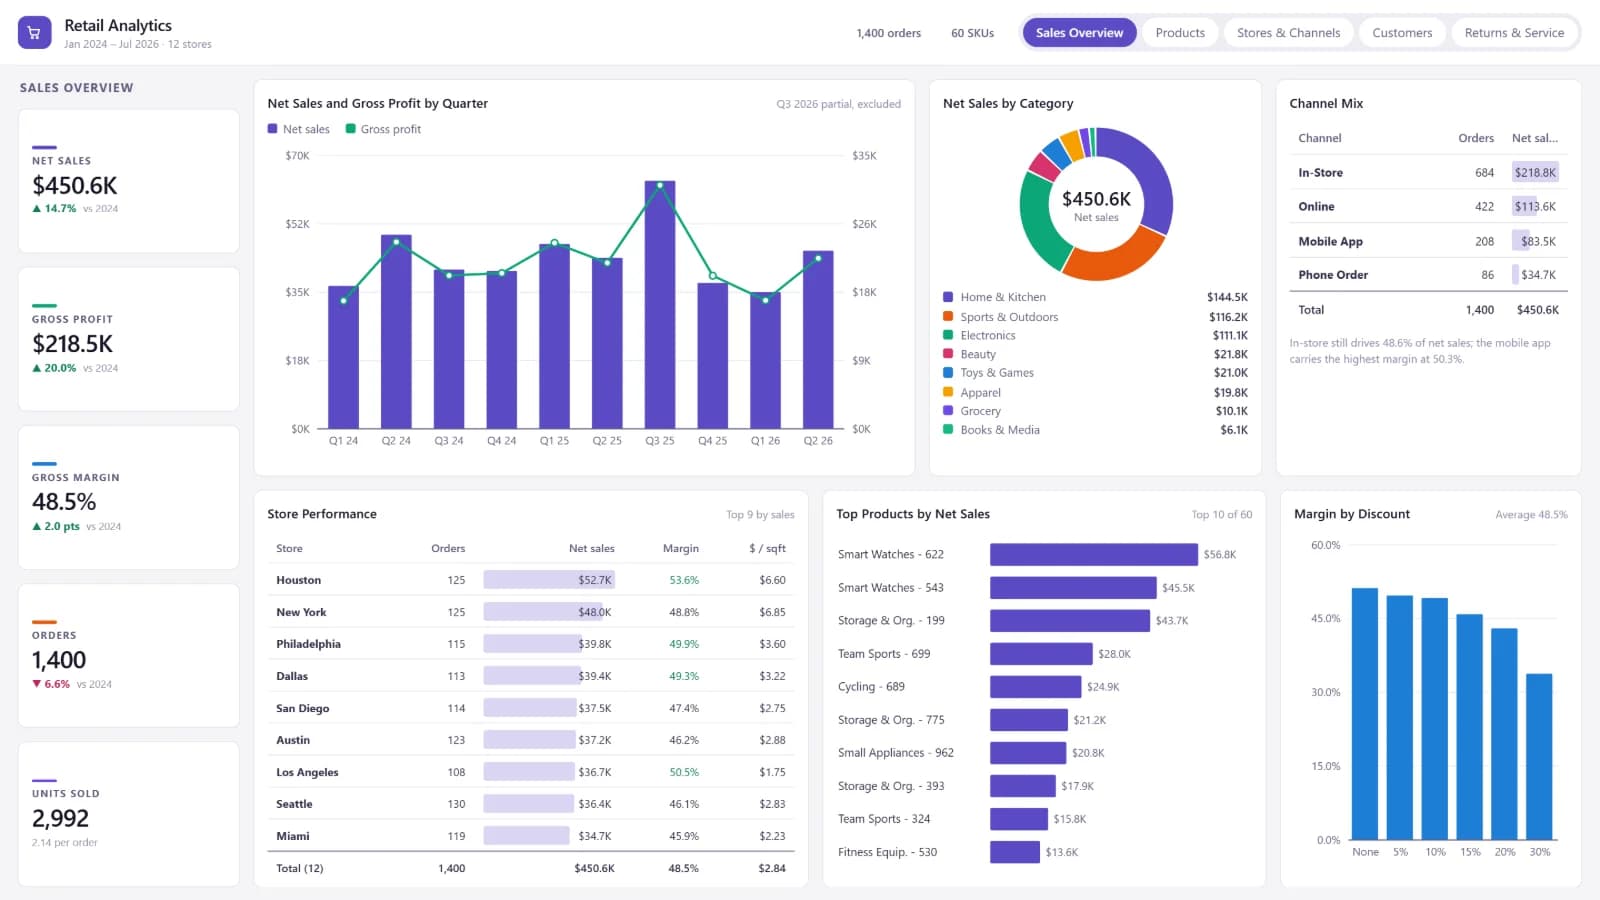
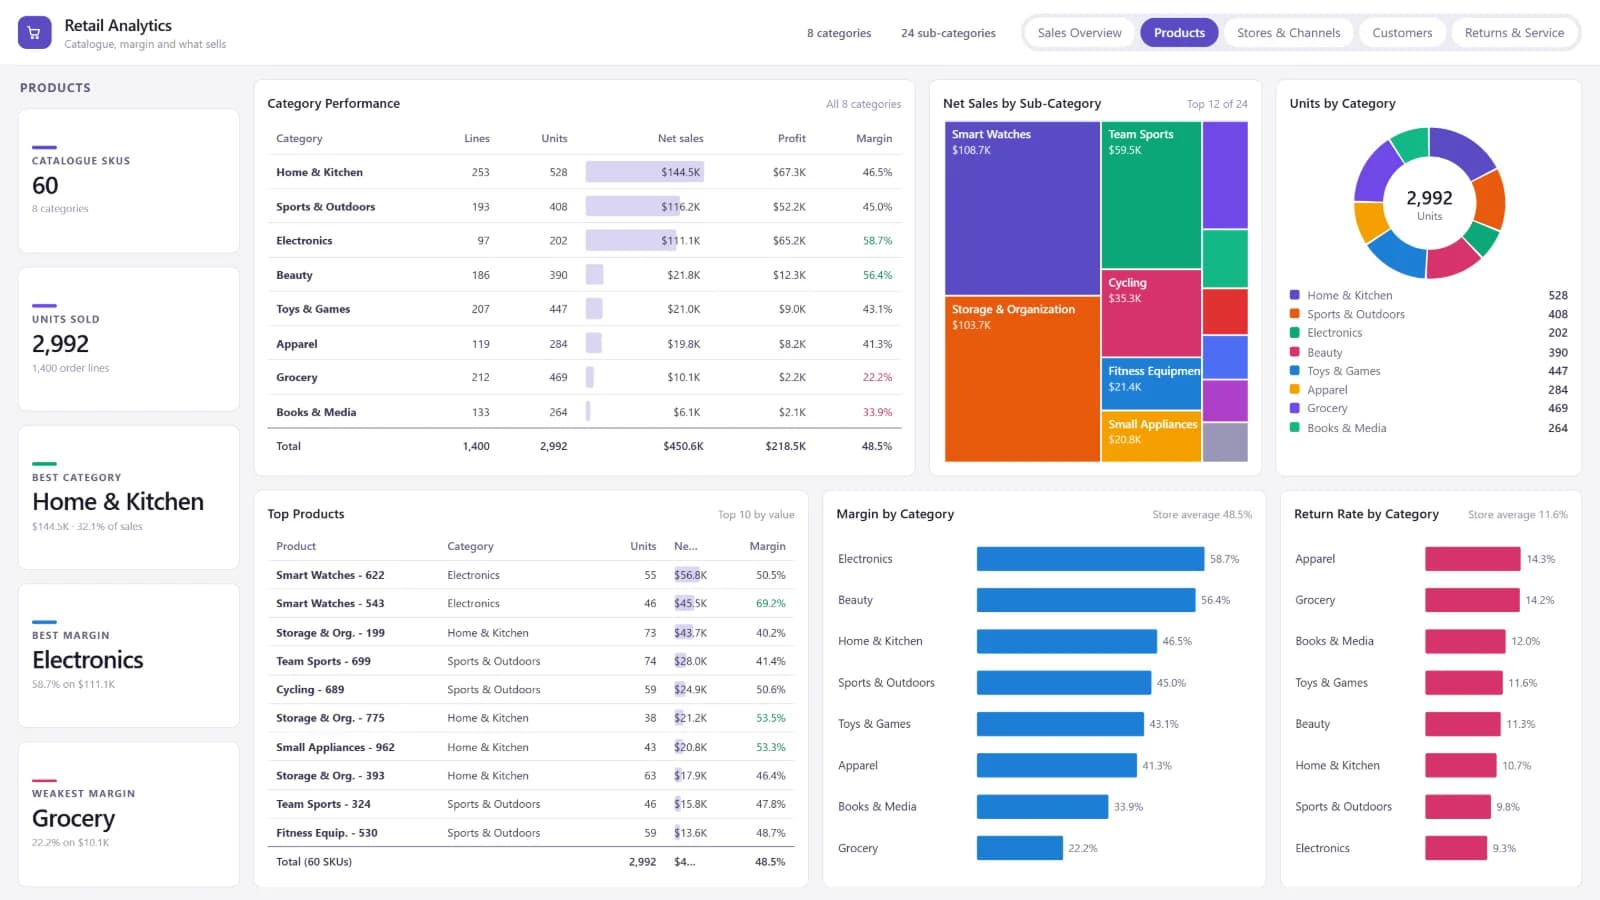
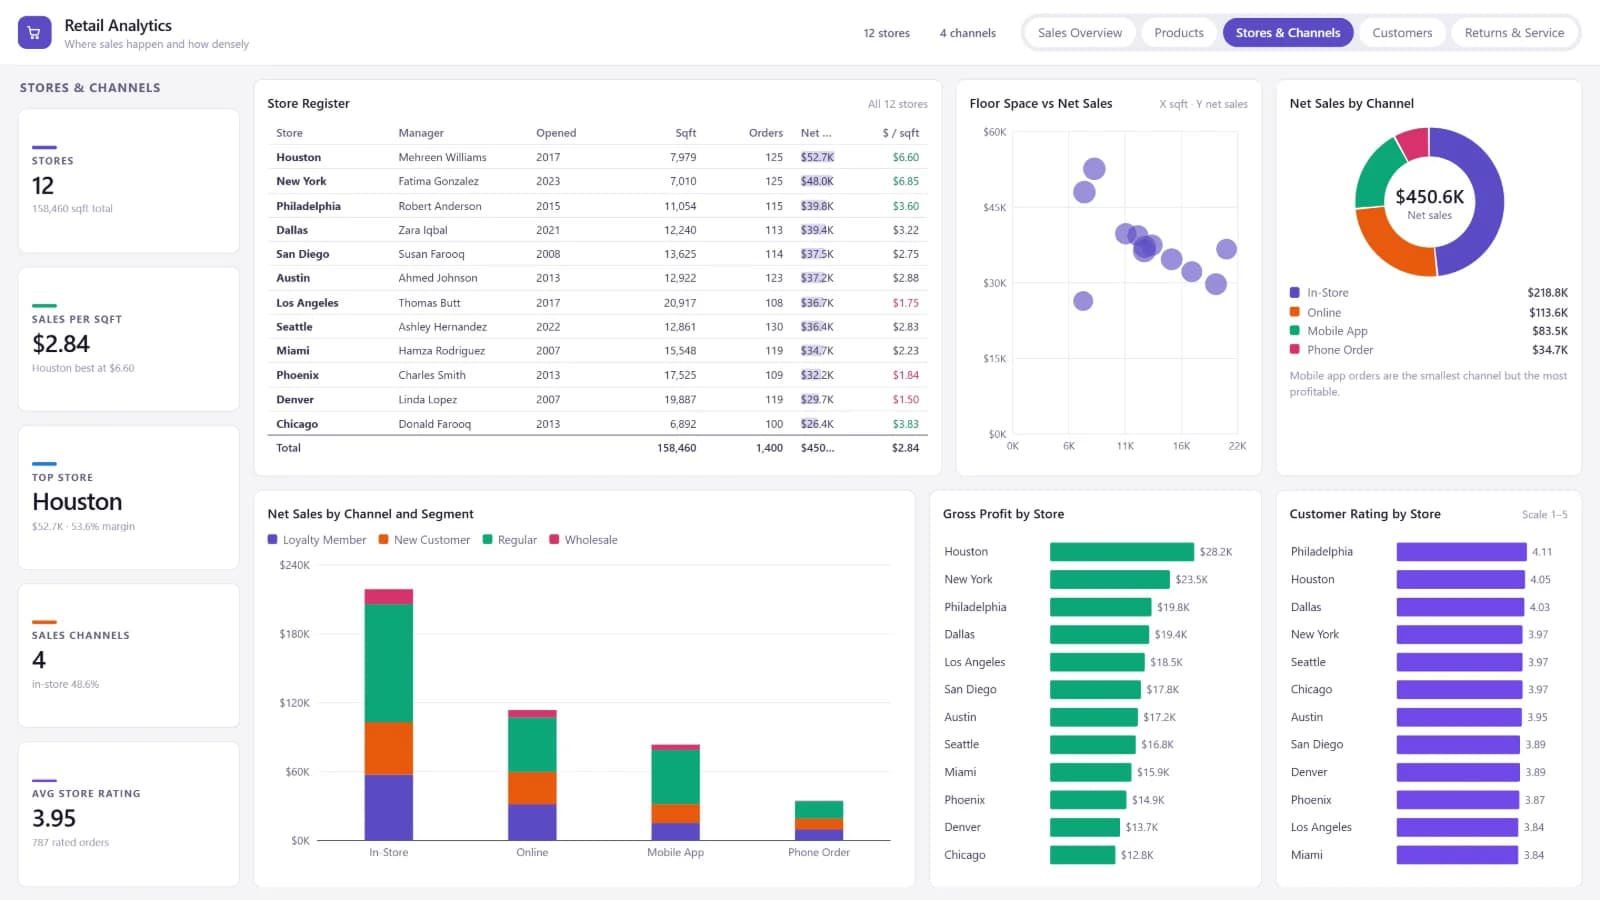
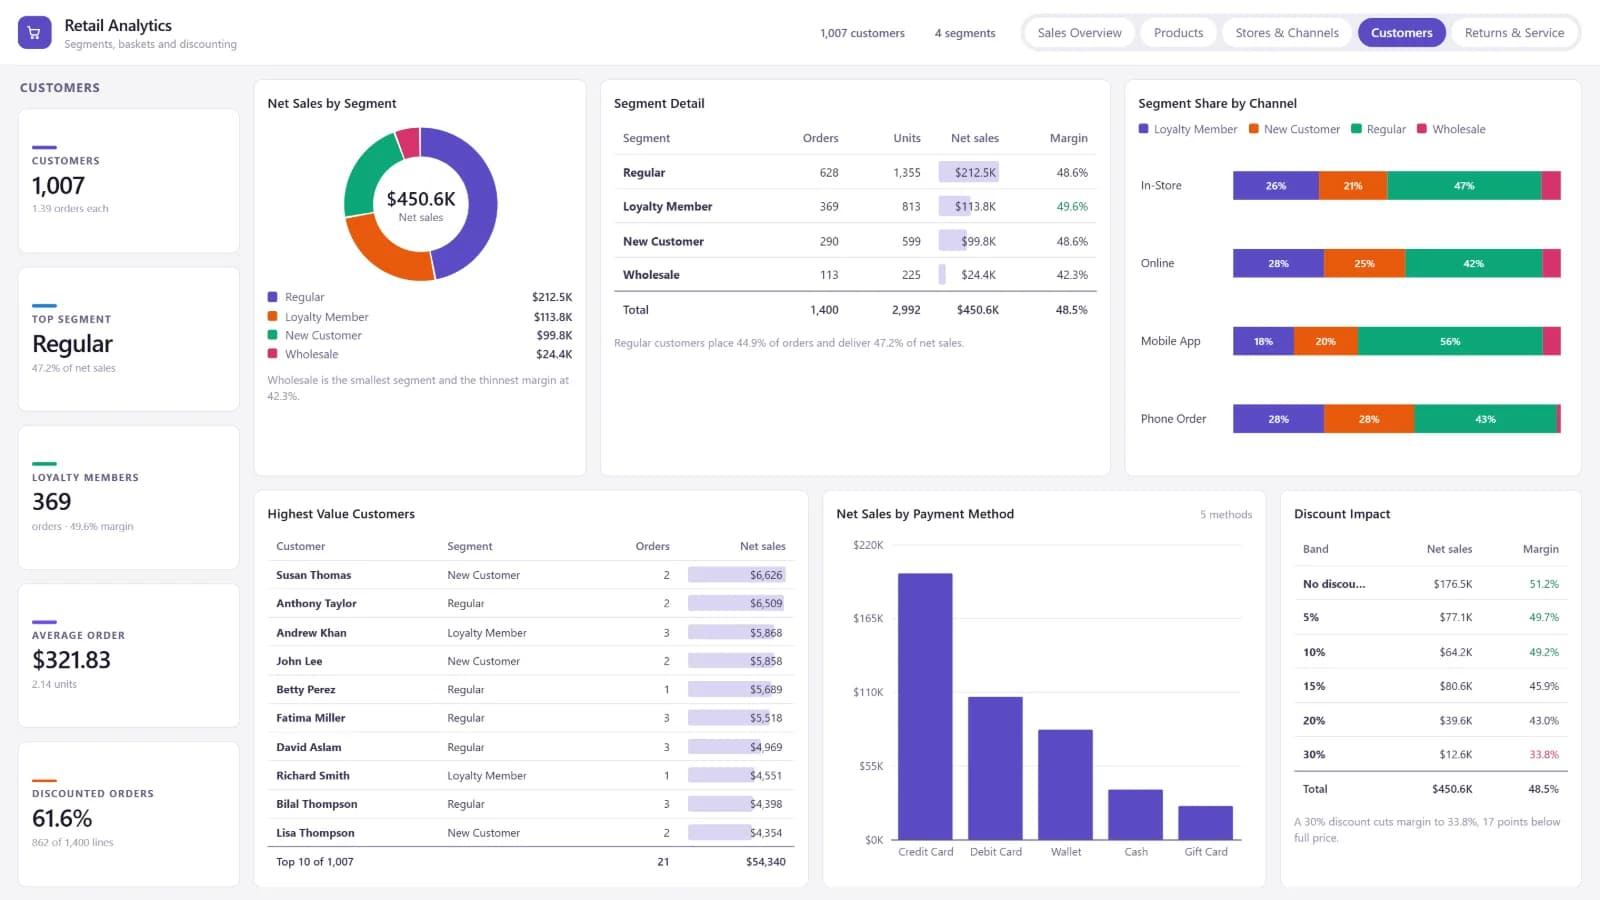
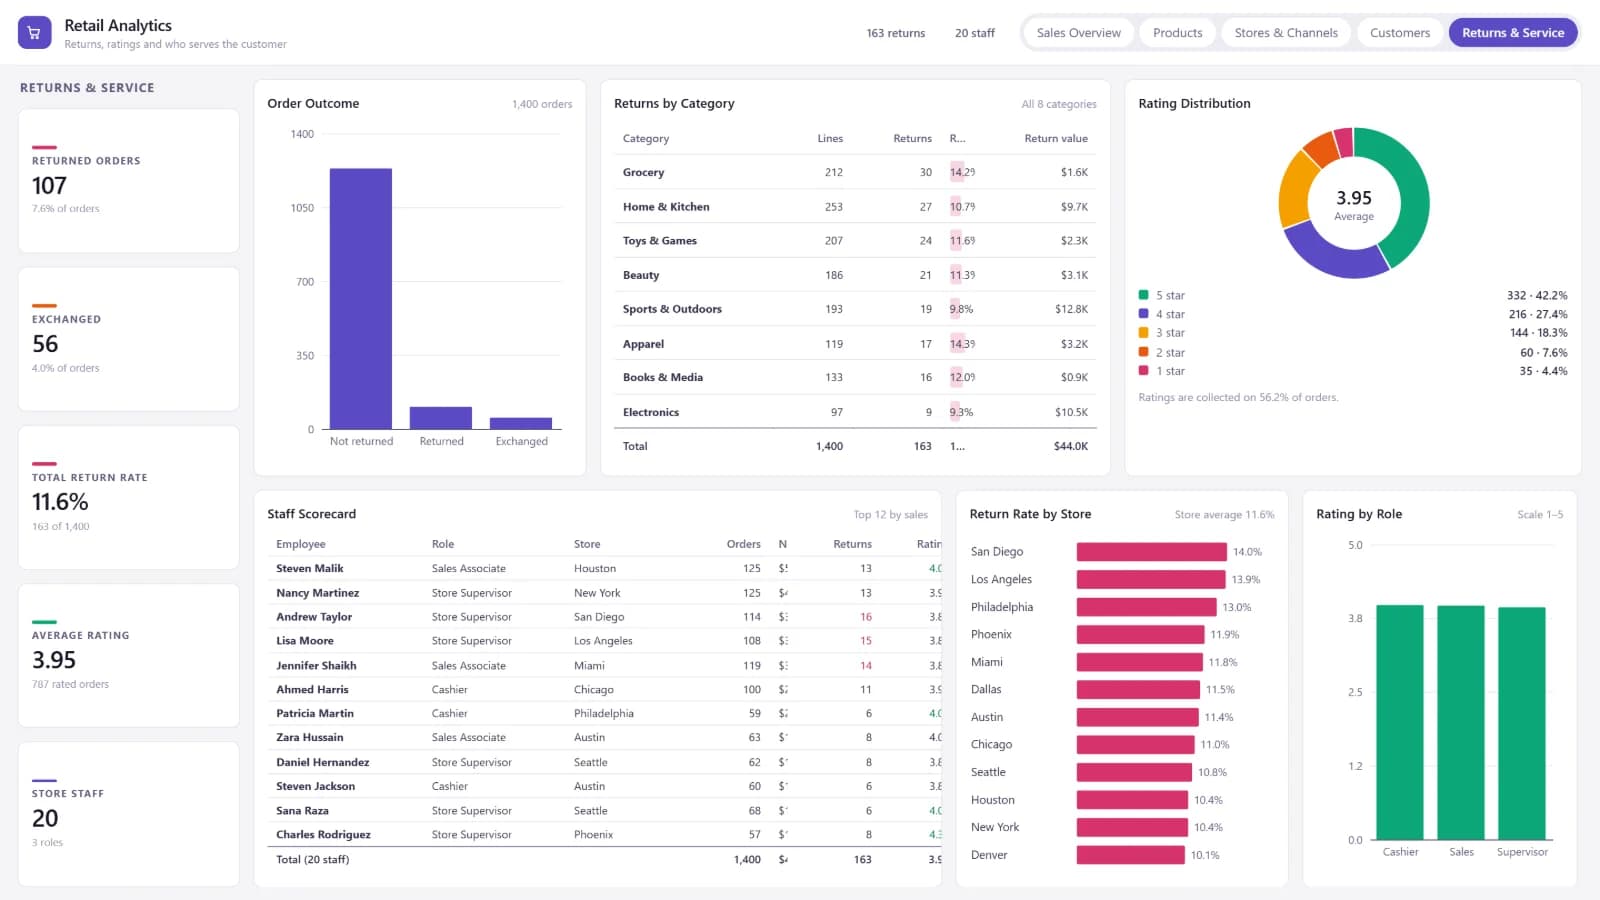
THE QUESTION
Is the business growing, and is margin holding as it does?
$450.6K
net sales, up 14.7%
48.6%
of net sales still come in-store
50.3%
margin on the mobile app, the highest channel
Want a report like this for your business?
Tell us the decision you need to get right. We'll show you what the data can answer in a free 30-minute call.