
HOME / WORK / REAL ESTATE SALES
CASE STUDY · REAL ESTATE
Real Estate Sales
LEAD AND BOOKING PERFORMANCE
Shows how 1,350 property leads across 20 cities turn into bookings, which agents and property types close the value, and how clients rate the experience.
TOTAL LEADS
1,350
up 11.4% vs 2024
BOOKINGS CLOSED
219
up 26.7% vs 2024
TOTAL SALES VALUE
$102.16M
up 26.5% vs 2024
COMMISSION EARNED
$2.55M
average rate 2.46%
WALK THE REPORT
Five pages, one question each
Each page answers one question the leadership team asks every week. Pick a page to see it full size.
THE QUESTION
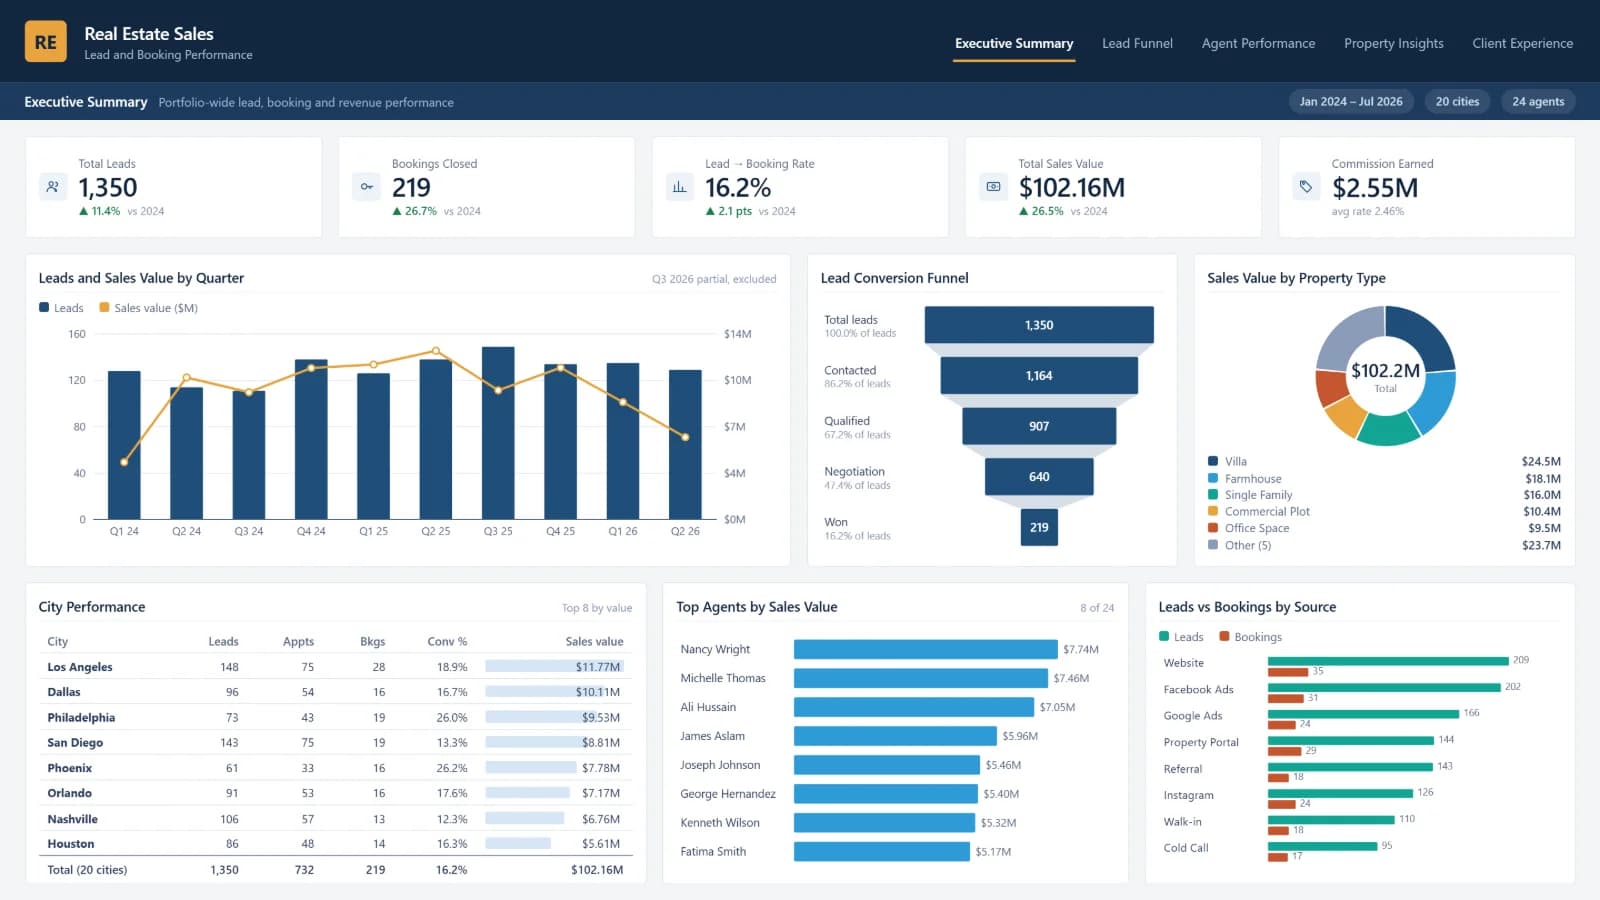
Are leads, bookings and sales value growing year on year?
16.2%
lead-to-booking rate, up 2.1 pts
$102.16M
total sales value
$11.77M
from Los Angeles, the top city
CONTEXT
Why an agency needs this report
Property sales teams measure activity well and outcomes badly. The CRM counts leads and calls, the sales ledger counts closed value, and the link between the two — which sources, cities, agents and property types actually convert — is rebuilt by hand whenever someone asks.
The cost is slow decisions. Marketing keeps paying for lead sources that never close, strong agents stay invisible in a team average, and nobody notices that a fifth of appointments end without an outcome until the quarter is over.
How the report is built
Five pages run from an executive summary through the lead funnel, agent performance, property insight and client experience, so one report serves both the weekly sales meeting and the board pack.
Leads, appointments, bookings and commission are modeled on a shared timeline, which is what makes cycle time — the 38.8 days from lead to booking — a number the team can manage rather than an anecdote.
WHAT IT BRINGS TOGETHER
- CRM leads and lead sources
- Appointments and meeting outcomes
- Bookings and closed sales value
- Commission rates
- Agent and team structures
- Property types, projects and cities
WHO IT SUITS
Estate agencies and developer sales teams working several cities or projects, where lead source, agent performance and closed value are not currently in one report.
PAGE BY PAGE
What each page of the real estate sales report answers
PAGE 01
Executive Summary
Portfolio-wide lead, booking and revenue performance
Are leads, bookings and sales value growing year on year?
- 16.2% lead-to-booking rate, up 2.1 pts
- $102.16M total sales value
- $11.77M from Los Angeles, the top city
PAGE 02
Lead Funnel
Where leads come from and where they drop out
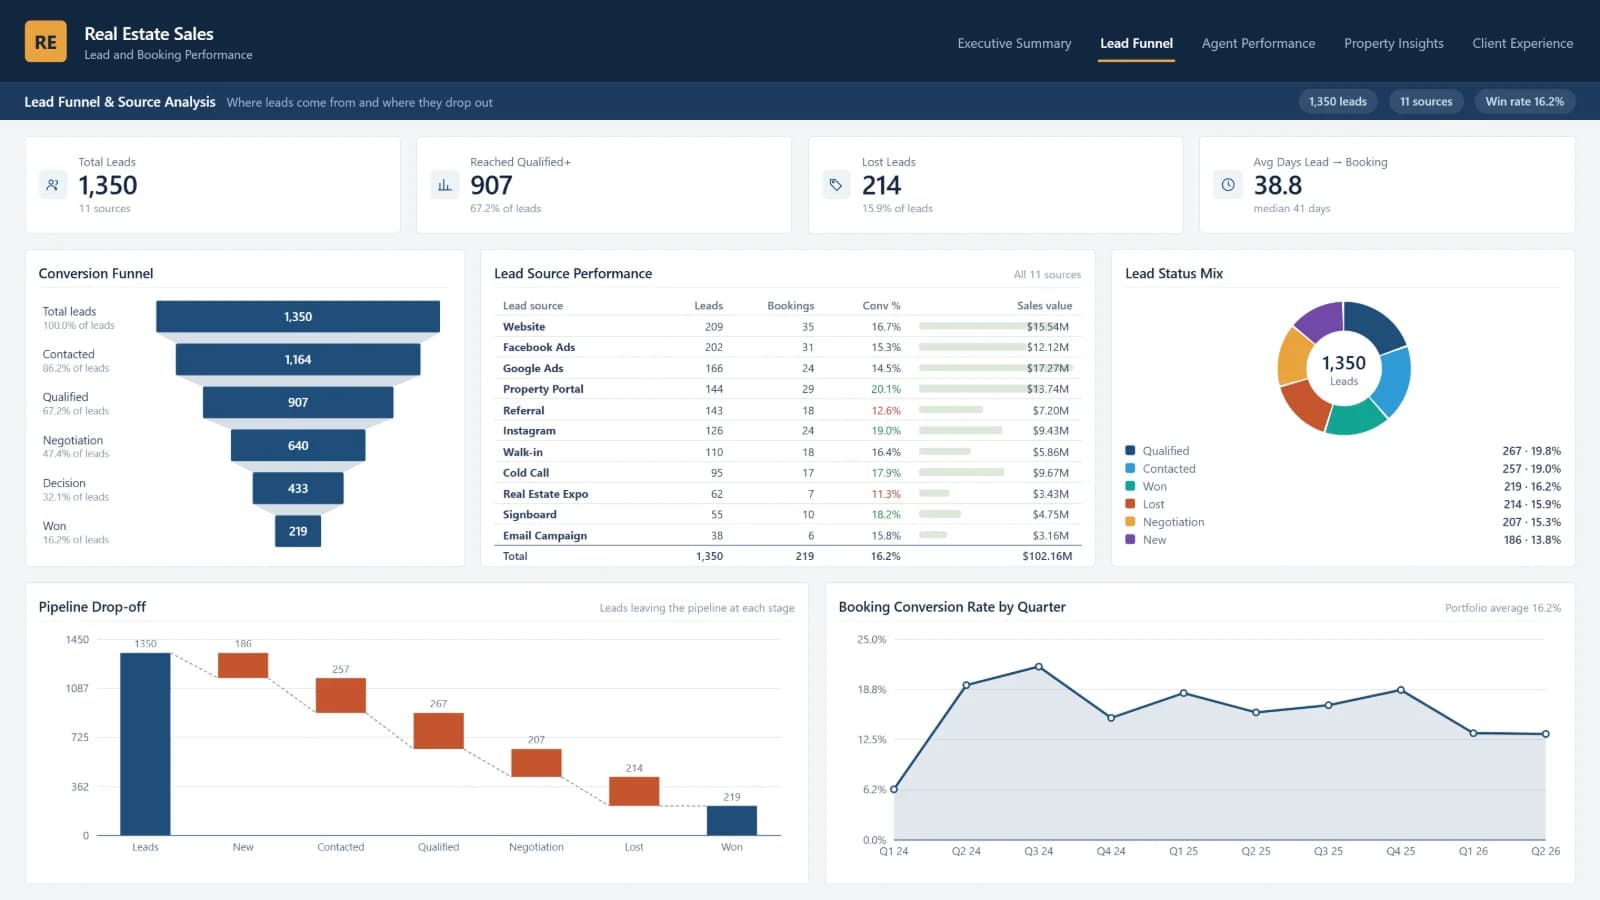
Where do leads come from, and where do they drop out?
- 907 leads reached qualified
- 214 leads lost
- 38.8 days on average from lead to booking
PAGE 03
Agent Performance
Individual and team contribution to closed value
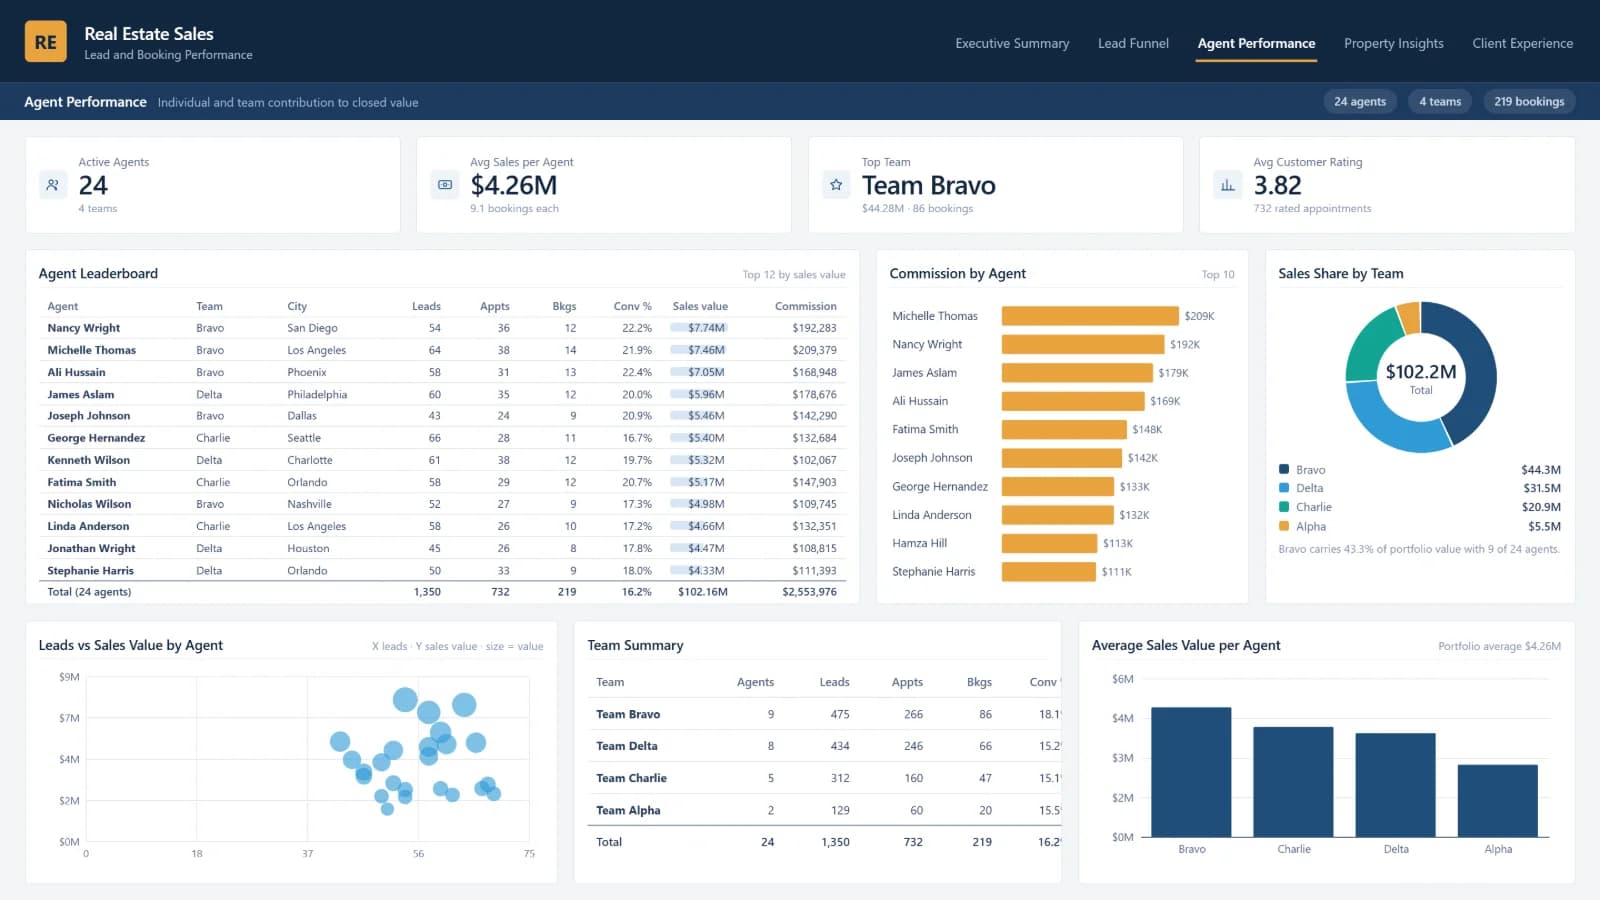
Which agents and teams close the most value?
- 24 active agents in 4 teams
- $4.26M average sales per agent
- Team Bravo the top-performing team
PAGE 04
Property Insights
Which product and which scheme converts budget into revenue
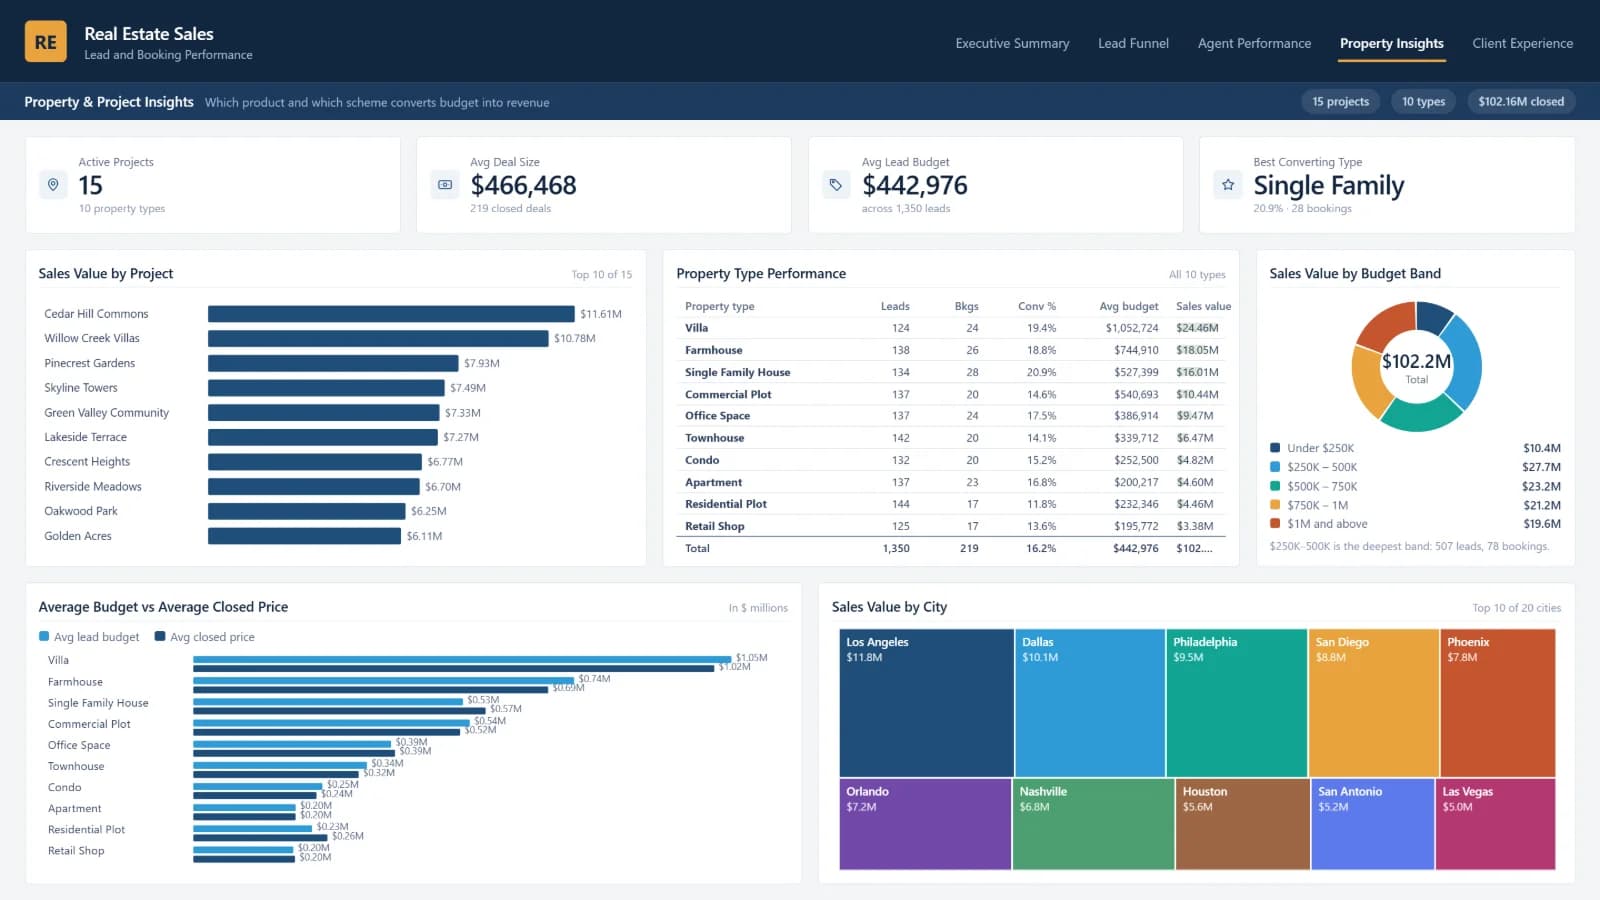
Which property types and projects turn budget into revenue?
- $466,468 average deal size
- Single Family the best-converting type
- $24.5M from villas, the largest type by value
PAGE 05
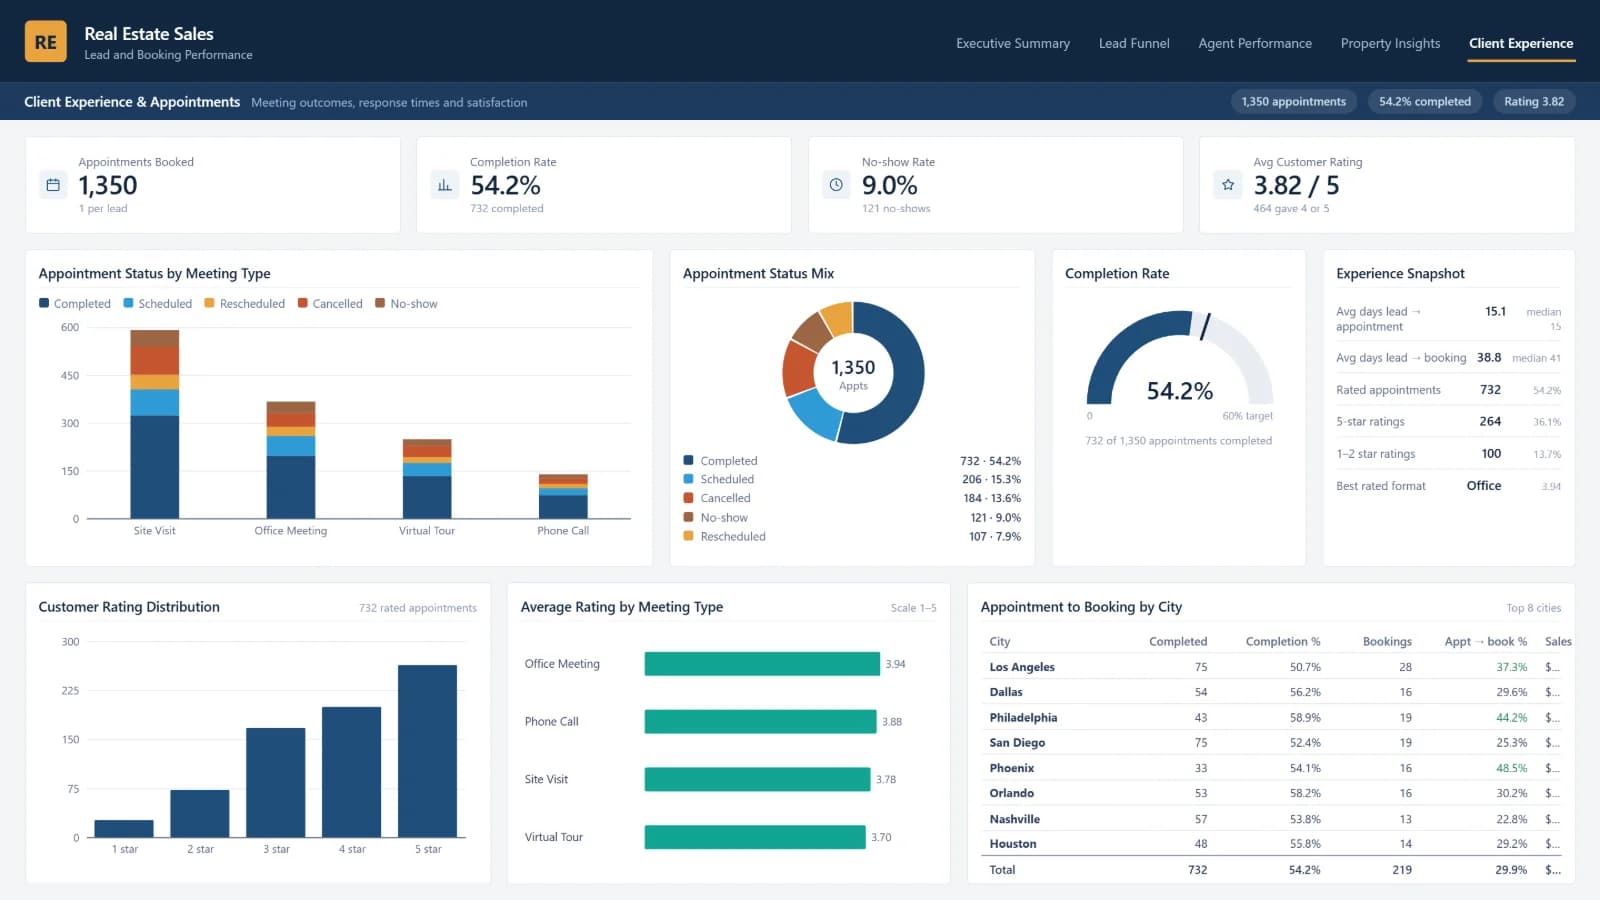
Client Experience
Meeting outcomes, response times and satisfaction
How do appointments go, and how do clients rate them?
- 1,350 appointments booked
- 54.2% completed, with 9.0% no-shows
- 3.82 / 5 average customer rating
What the report surfaced
Figures the real estate report puts in front of the leadership team every week.
- 1,350 leads (up 11.4%) produced 219 bookings (up 26.7%) and $102.16M of sales value (up 26.5%), earning $2.55M in commission at an average 2.46% rate.
- The lead-to-booking rate is 16.2%, up 2.1 points, and Los Angeles alone accounts for $11.77M of value.
- 907 leads reach qualified and 214 are lost, with an average 38.8 days from first contact to a booking.
- 24 agents across 4 teams average $4.26M each, on an average deal size of $466,468; villas are the largest type by value at $24.5M.
- Of 1,350 appointments, 54.2% complete and 9.0% are no-shows, with an average client rating of 3.82 out of 5.
Want a report like this for your business?
Tell us the decision you need to get right. We'll show you what the data can answer in a free 30-minute call.