
HOME / WORK / SELF STORAGE SALES
CASE STUDY · SELF STORAGE
Self Storage Sales
12 FACILITIES · 6 STATES
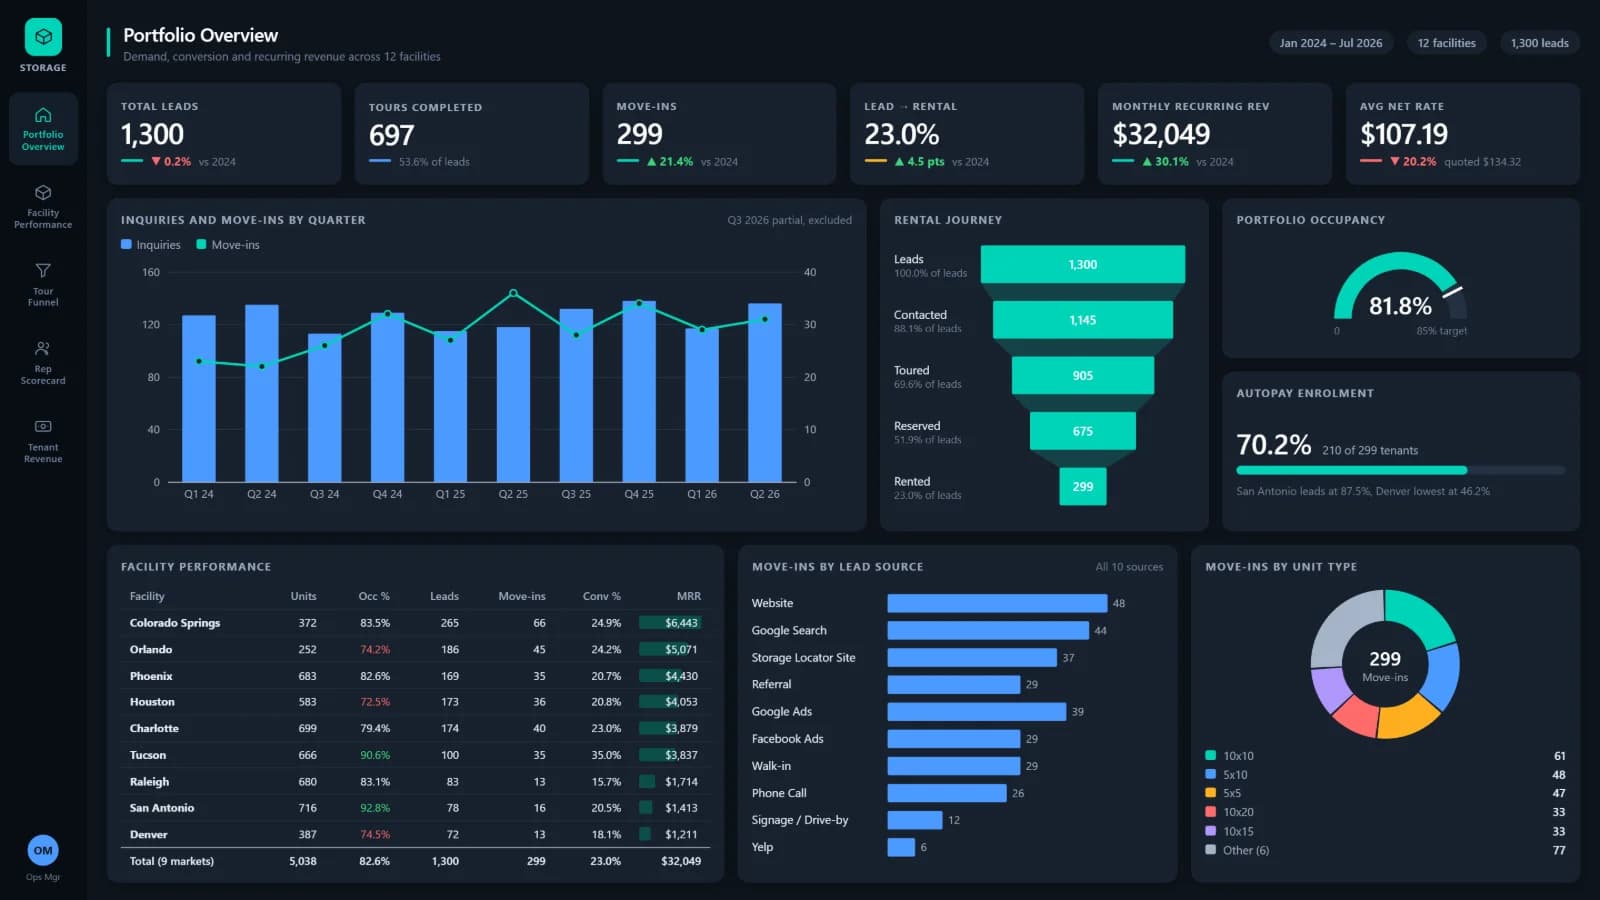
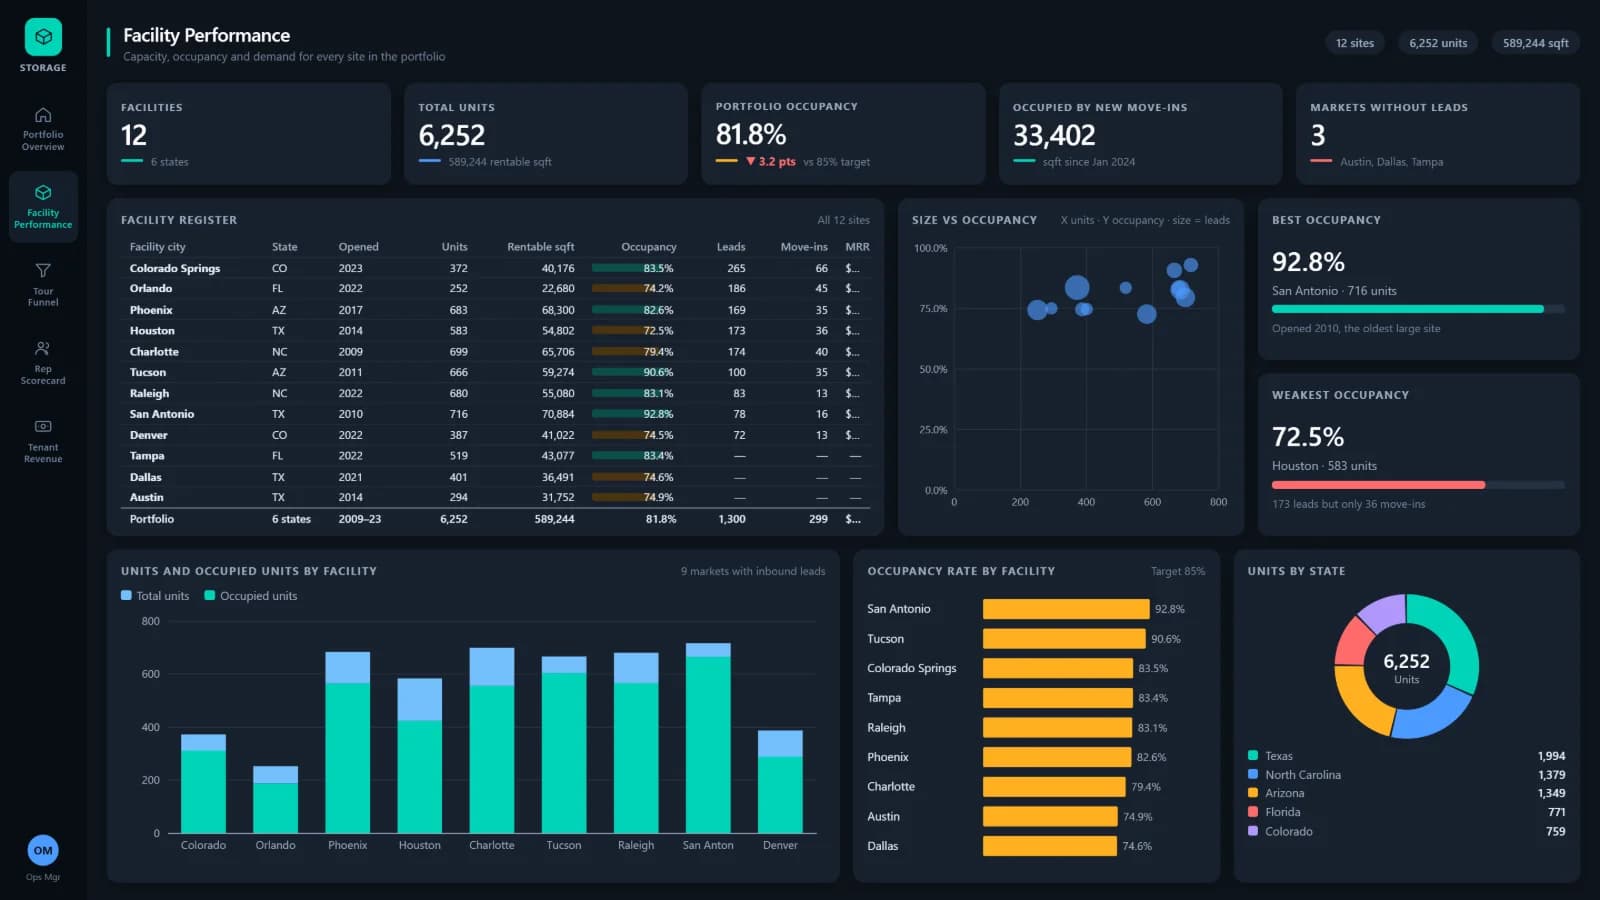
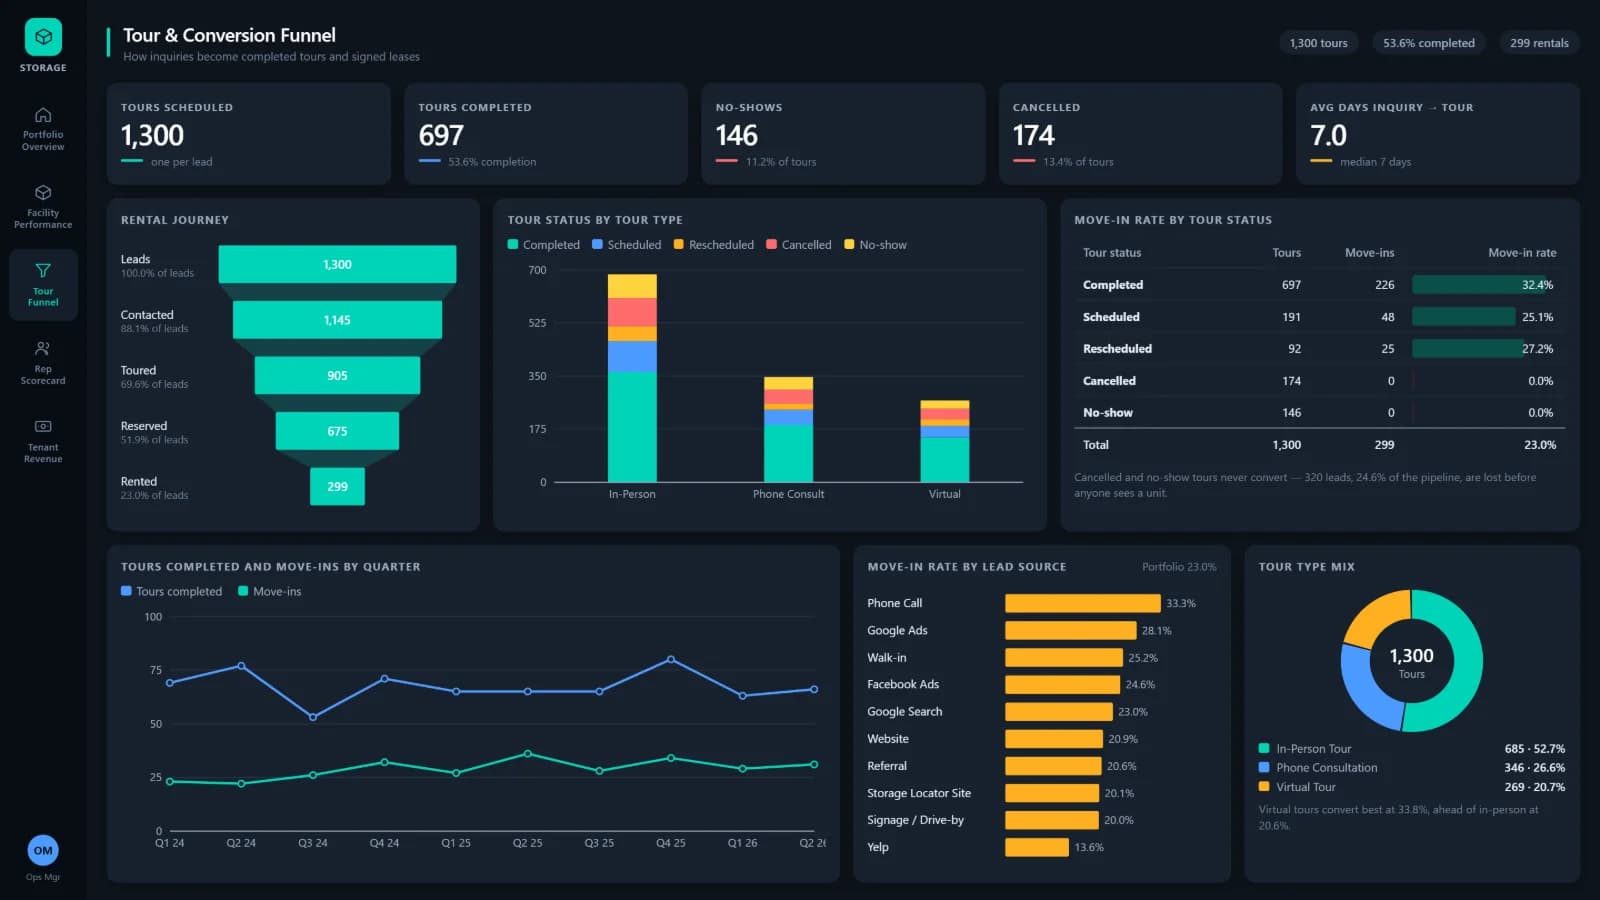
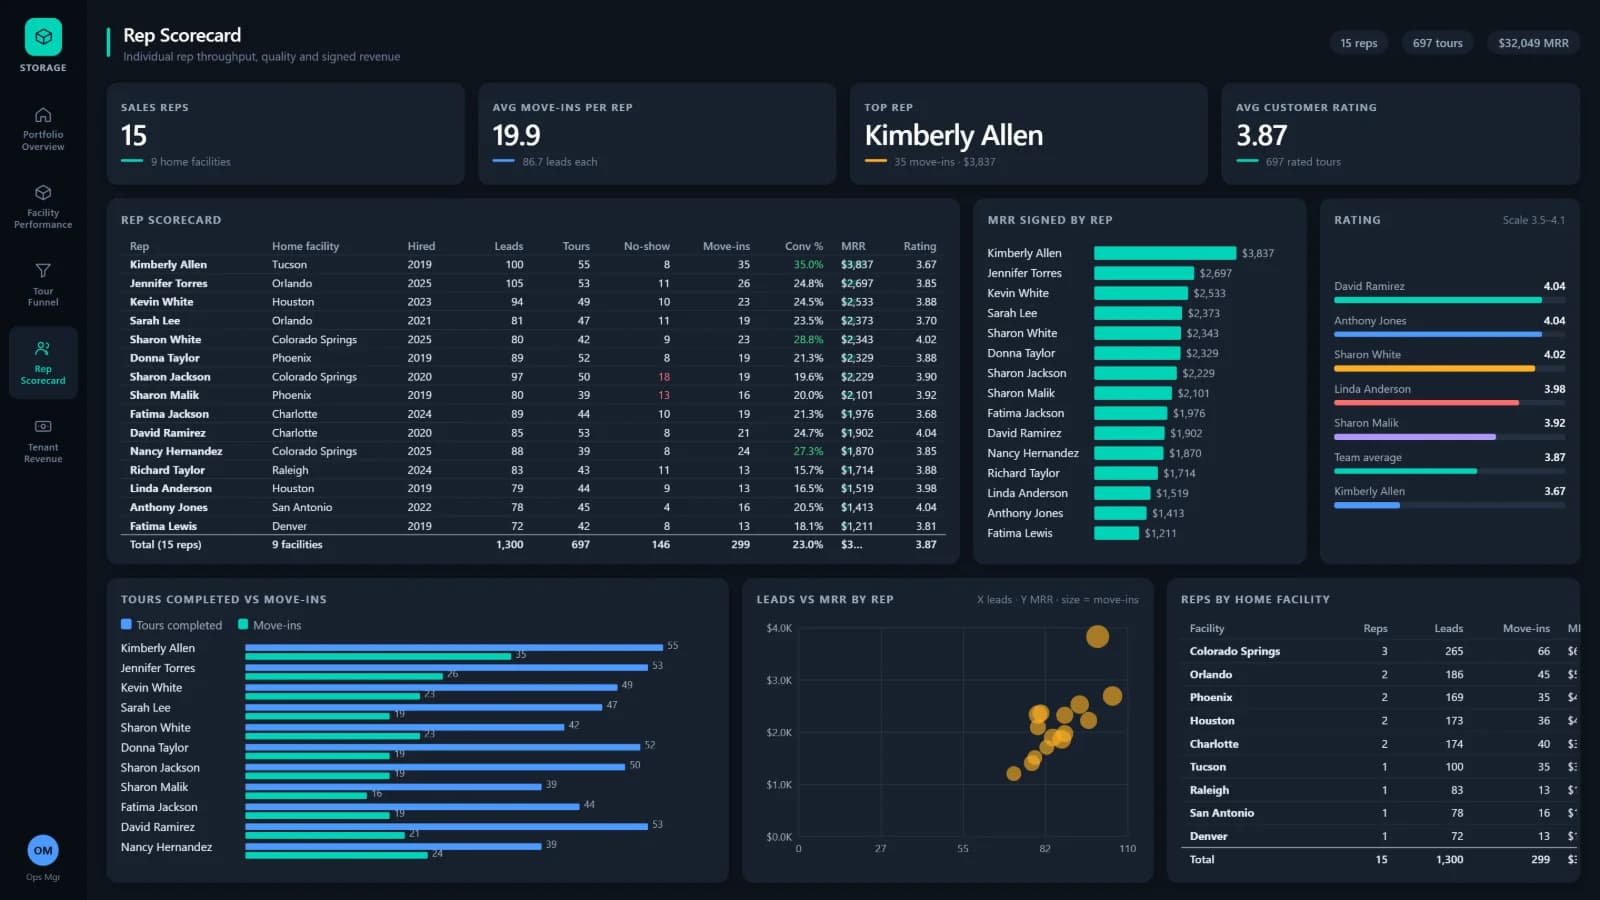
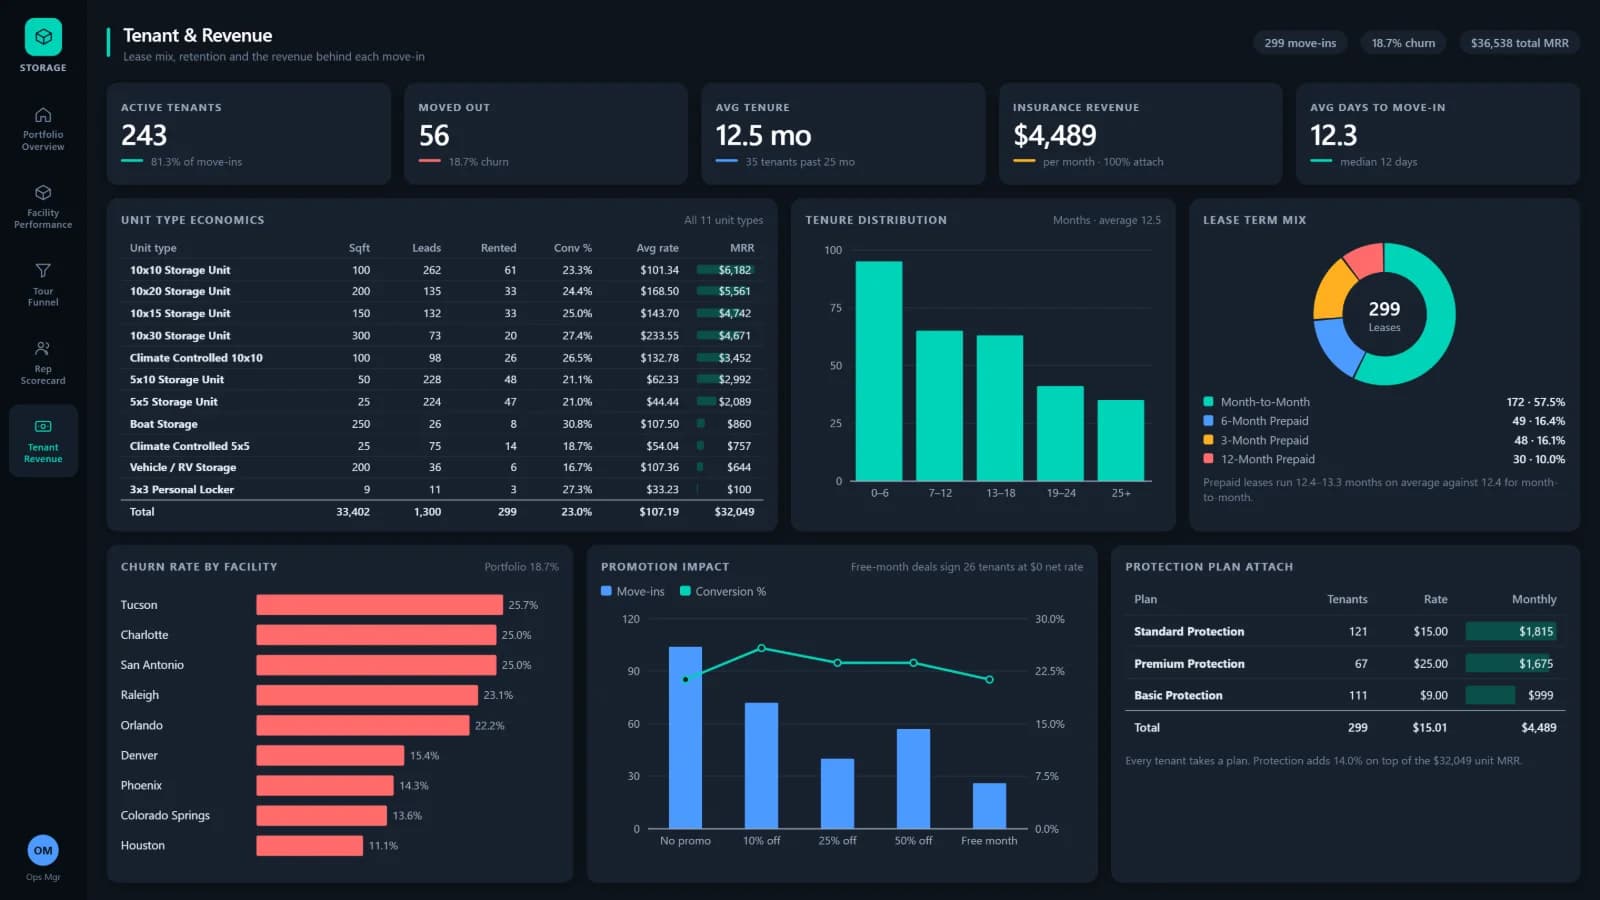
Tracks demand, tours and move-ins across 12 self-storage facilities, with rep scorecards and the recurring revenue each new tenant brings.
TOTAL LEADS
1,300
Jan 2024 – Jul 2026
MOVE-INS
299
up 21.4% vs 2024
LEAD → RENTAL
23.0%
up 4.5 pts vs 2024
MONTHLY RECURRING REV
$32,049
up 30.1% vs 2024
WALK THE REPORT
Five pages, one question each
Each page answers one question the leadership team asks every week. Pick a page to see it full size.
THE QUESTION
Is demand turning into rentals and recurring revenue?
697
tours completed, 53.6% of leads
81.8%
occupancy against an 85% target
70.2%
of new tenants on autopay
Want a report like this for your business?
Tell us the decision you need to get right. We'll show you what the data can answer in a free 30-minute call.